Practice Test: Mathematics, Science, and Technology/Engineering (278)
Suggested Testing Time: 4 hours
To Take This Practice Test
- Use the answer key to record your responses.
- Prefer to take it offline? You can print the questions and answer key.
Remember:
- The practice test can give you a good indication of how you may perform on an actual test, but there is no guarantee that your results will be the same as on the actual test.
- The actual test looks and operates differently than this practice test. Review the Testing Tutorials and Demonstrations for more information about the actual test platform. In addition, this test includes one or more assignments that allow you to handwrite and scan your responses. Review the Testing Tutorials and Demonstrations for more information about the actual test platform.
-
A standard 4-function calculator
 is provided on-screen with your actual test.
Question 1.
A teacher plans an activity in which students will use a ten frame and counters, as shown below, to develop their understanding of one-to-one correspondence.

An empty ten frame is shown. A pile of 10 counters is positioned beside it.
Which of the following activities is most appropriate for this learning goal?
- The teacher adds 5 counters to the ten frame and has the students count them aloud. The teacher asks the students how many counters are present.
- The teacher has the students count aloud from 1 to 10. The students pick up counters and add them to the ten frame as they say each number.
- The students add 8 counters to a ten frame. The teacher then asks the students if the numbers 6 and 10 could be made from the counters on the ten frame.
- The students add 3 counters to a ten frame and then rearrange the counters into different positions. The teacher asks the students if the number of counters changed.
Question 2.
Which of the following statements about the values represented by the digits in the number 24.24 is correct?
- The number 24.24 is equivalent to 24 times the quantity 10 to the power of 0 plus 10 to the power of negative 2
- The number 24.00 is 1000 times the value of the number 0.24.
- The value represented by each digit is 10 times the value represented by the digit to its right.
- The value represented by each "2" digit is 16 more than the value represented by the digit to its right.
Question 3.
Use the diagram below to answer the question that follows.
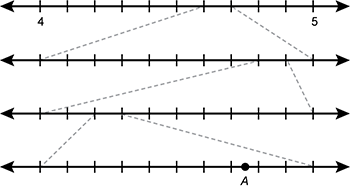
A number line is shown with a minimum of 4 and a maximum of 5. The space between the 4 and 5 is divided into tenths using tick marks. Dotted lines extend from the 6th and 7th tick marks down to the ends of a second number line, which is also divided into tenths. Dotted lines extend from the 7th and 8th tick marks of the second number line down to the ends of a third number line that is also divided into tenths. Dotted lines extend from the 3rd and fourth tick marks of the third number line down to a final number line that is also divided into tenths. The point A is located halfway between the 7th and 8th tick marks on the final number line.
The diagram shows how the subintervals of a number line are divided into segments of equal length. Which of the following numbers is represented by A?
- 4.68275
- 4.69375
- 4.78285
- 4.79385
Question 4.
A student writes out a list of all the factors of 105. Which of the following ratios compares the number of prime factors to the total number of factors?
- 3:8
- 3:5
- 1:2
- 1:1
Question 5.
Which of the following sets of real numbers is ordered from least to greatest?
- left brace 7 eighths, 0 point 7, 0 point 0 7, 0 point 7 1, 0 point 7 0 7, 0 point 0 7 7, 7 elevenths right brace
- left brace 0 point 0 7, 0 point 0 7 7, 7 elevenths, 0 point 7, 0 point 7 0 7, 0 point 7 1, 7 eighths right brace
- left brace 7 elevenths, 0 point 7, 0 point 0 7, 0 point 7 1, 0 point 7 0 7, 0 point 0 7 7, 7 eighths right brace
- left brace 0 point 0 7, 0 point 0 7 7, 0 point 7, 7 eighths, 0 point 7 0 7, 0 point 7 1, 7 elevenths right brace
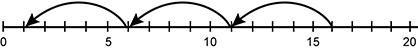
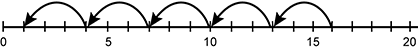
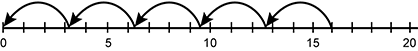
Question 6.
Which of the following number lines could be used to accurately represent how 16 dollars would be shared equally among 5 people?
- A number line is shown that starts at 0 and extends to 20 in units of 1. An arrow extends to the left from 16 to 11, then from 11 to 6, and then from 6 to 1.
- A number line is shown that starts at 0 and extends to 20 in units of 1. An arrow extends to the left from 16 to 13, then from 13 to 10, then from 10 to 7, then from 7 to 4, and then from 4 to 1.
- A number line is shown that starts at 0 and extends to 20 in units of 1. An arrow extends to the left from 16 to 11, then from 11 to 6, then from 6 to 1, and then from 1 to 0.
- A number line is shown that starts at 0 and extends to 20 in units of 1. An arrow extends to the left from 16 in 5 equal jumps of 3 point 2.

Question 7.
A restaurant prices a special omelet for 4 dollars and 25 cents above the cost of its ingredients. Each omelet uses 3 eggs, and the restaurant purchases eggs in bulk cases of 30 dozen eggs for 259 dollars . Additionally, they estimate that they use 4 dollars and 90 cents in other ingredients per omelet. Which of the following expressions most closely approximates the price of the restaurant's special omelet?
- 4 plus the quantity 360 divided by 360 plus 5
- 4 point 2 5 plus the quantity 260 divided by 360 plus 4 point 9 0
- 4 point 2 5 plus the quantity 260 divided by 120 plus 4 point 9 0
- 5 plus the quantity 300 divided by 100 plus 5
Question 8.
Use the diagram below to answer the question that follows.
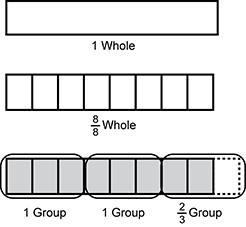
A rectangular bar is shown which represents 1 whole. Below it, the bar is divided into 8 equal sections using vertical lines to indicate a value of 1 whole in the form of 8 over 8. Below that, the same bar shows three circles that divide the eighths into groups of 3. Below each complete group of 2 is the text "1 group", while under the incomplete group of 2 is written "2 thirds of a group."
This diagram would be most appropriate to include as part of the solution to which of the following problems?
- Three people walked a total of 2 and 2 thirds miles. Two people walked the same distance, and the other person walked 1 ninth of a mile less. How far did the person who walked the shorter distance walk?
- A person typically walks at a rate of 1 third mile every 10 minutes. At this rate, how many minutes would it take that person to walk 1 mile?
- A person typically walks 3 eighths mile in 9 minutes. How many minutes would it take them to walk 1 mile?
- Three people each run a total of 1 and 1 third miles. How far did each person run if they each ran the same amount?
Question 9.
Use the diagram below to answer the question that follows.
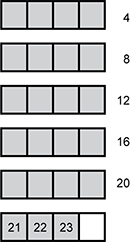
6 bars are shown, each divided into fourths. The first 5 bars are shaded gray, and the values 4, 8, 12, 16, and 20 appear to the right of them, respectively. In the sixth bar, 3 of the 4 regions in the bar are shaded. The shaded regions are labeled 21, 22, and 23.
The diagram shown is most effective for illustrating which of the following relationships?
- 23 fourths is equal to 1 divided by the fraction 4 twenty thirds
- 23 fourths divided by 4 twenty thirds = 1
- 5 and 3 fourths = 5 times the fraction 3 times 6 over 4 times 6.
- 5 and 3 fourths = the quantity 4 times 5 plus 3 all divided by 4

Question 10.
A student estimates the value of the expression 3 and 5 sixths plus 2 and 1 tenth plus 4 and 1 fourth minus 5 and 1 eighth by rounding each fraction to the nearest whole number. Which of the following statements about the student's estimate is accurate?
- The student's estimate is 7 1 hundred twentieths less than the actual value of the expression.
- The student's estimate is 47 1 hundred twentieths greater than the actual value of the expression.
- The student's estimate is 77 1 hundred twentieths greater than the actual value of the expression.
- The student's estimate is 7 1 hundred twentieths greater than the actual value of the expression.
Question 11.
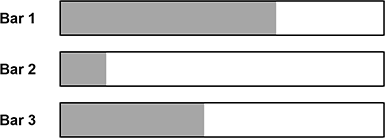
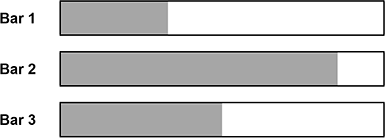
Use the information below to answer the question that follows.
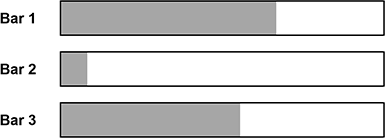
A teacher creates an activity in which students work in pairs to describe the shaded area in a set of bars to a classmate using ratios. One student's description for a set is shown in the table below.
| Bar 1 | The ratio of the shaded area to the unshaded area is approximately 2:1. |
|---|---|
| Bar 2 | The ratio of the shaded area to the unshaded area is approximately 1:6. |
| Bar 3 | The ratio of the shaded area to the unshaded area is approximately 4:5. |
Which of the following sets of shaded regions is consistent with the student's description?
- Three partially shaded bars are shown. The approximate amount of shading in each bar is as follows: bar 1, between 65 and 75 percent; bar 2, between 10 and 20 percent; bar 3, between 40 and 50 percent.
- Three partially shaded bars are shown. The approximate amount of shading in each bar is as follows: bar 1, between 30 and 40 percent; bar 2, between 80 and 90 percent; bar 3, between 50 and 60 percent.
- Three partially shaded bars are shown. The approximate amount of shading in each bar is as follows: bar 1, between 65 and 75 percent; bar 2, between 5 and 10 percent; bar 3, between 50 and 60 percent.
- Three partially shaded bars are shown. The approximate amount of shading in each bar is as follows: bar 1, between 65 and 75 percent; bar 2, between 85 and 95 percent; bar 3, between 25 and 35 percent.

Question 12.
A customer purchases 6 single-serving containers of cat food for 3 dollars and 25 cents . If the price per serving remains constant, what is the cost for a box of 40 single-serving containers of the same cat food?
- 20 dollars and 80 cents
- 21 dollars and 13 cents
- 21 dollars and 67 cents
- 22 dollars
Question 13.
An item at a local store is on sale for 20% off and its discounted price is 104 dollars . What is the original price for the item?
- 124 dollars and 80 cents
- 130 dollars
- 187 dollars and 20 cents
- 191 dollars
Question 14.
The equation 2 m times open paren 2 k plus 1 close paren equals 4 m k plus 2 m = 4mk + 2m can be used to justify which of the following statements?
- The product of an even integer and an odd integer is an even integer.
- The product of two consecutive integers is an odd integer.
- The product of an even integer and an odd integer is a multiple of 4.
- The product of two consecutive integers is a multiple of 4.
Question 15.
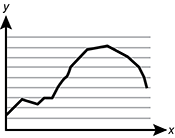
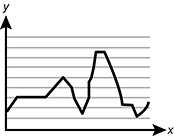
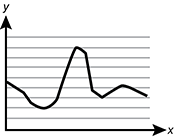
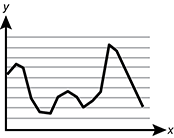
A fitness center is open from 5:00 a.m. to 9:00 p.m. on weekdays. The fitness center is busiest before 8:00 a.m. and from 5:00 p.m. to 7:00 p.m. The number of people at the fitness center during lunch hours is approximately half of the number of people during peak hours. Which of the following graphs most accurately represents the number of people at the fitness center from the time it opens to the time it closes?
- A line graph is shown with 8 horizontal gridlines above the x axis. The line begins between the second and third gridlines and gradually moves up to the fourth gridline over the first quarter of its horizontal distance. The line then forms a downward opening arc that peaks at the eighth gridline at a point approximately 3-quarters of its total horizontal distance.
- A line graph is shown with 8 horizontal gridlines above the x axis. The line begins just below the second gridline and moves up to the the fifth gridline in the first third of its length. The line then drops below the second gridline and then rises up above the seventh gridline in the middle third of its length. The line then drops again and ends between the second and third gridlines.
- A line graph is shown with 8 horizontal gridlines above the x axis. The line begins between the fifth and sixth gridlines and gradually drops to the second gridline over the first third of its length. The line then forms a downward opening arc over the middle third of its length that peaks at the seventh gridline and then drops back down to the third gridline. The line then remains approximately flat for the rest of its length.
- A line graph is shown with 8 horizontal gridlines above the x axis. The line begins just above the sixth gridline, rises slightly a short distance to the right, and then sinks down below the second gridline at the end of the first third of its length. The line moves between the first and fourth gridlines over the middle third of its length. In the last third, the graph quick rises over the seventh gridline and then gradually drops to the second gridline.
Question 16.
Use the diagram below to answer the question that follows.
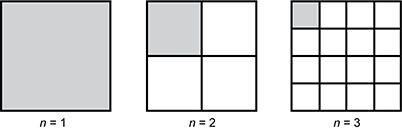
A patten of a square divided into smaller squares is shown. The first square, labeled n equals 1, is fully shaded. The second square, labeled n equals 2, is divided into 4 equal parts, 1 of which is shaded. The third square, labeled n equals 3, is divided into 16 squares, 1 of which is shaded.
A geometric pattern is formed by dividing a square with an initial edge length of 1 unit into smaller squares. The first three steps of this pattern are shown. Which of the following expressions represents the area of the shaded region for n = 8?
- ( 1 fourth raised to the seventh power
- ( The fraction 1 fourth divided by 8
- 1 minus 1 fourth raised to the seventh power
- ( 1 fourth raised to the eighth power
Question 17.
Which of the following equations represents the line 2 x minus 3 y = 9?
- y = 3 halves x minus 3
- y = negative 2 thirds x minus 3
- y = 2 thirds x minus 3
- y = x + 3 3 halves x plus 3
Question 18.
A kayak is on sale for 30% off the regular price. A customer uses a coupon that reduces the sale price by an additional 20%. Ignoring sales tax, the final price of the kayak is what percent of its original retail price?
- 50%
- 56%
- 60%
- 64%
Question 19.
Use the table below to answer the question that follows.
| Conference Duration (days) | Total Cost (dollars) |
|---|---|
| 1 | 2,500 |
| 2 | 5,000 |
| 3 | 7,500 |
| 4 | 10,000 |
| 5 | 12,500 |
An event manager at a company intends to rent a conference room for an upcoming event. The total cost to rent this conference room for up to five days is shown in the table. Which of the following statements about the total cost is accurate?
- The rate of change in the total cost to rent a conference room increases as the number of days increases.
- The amount the total cost increases each day is constant.
- The total cost to rent a room for a conference is a sum of a fixed fee of 500 dollars and a constant rate per day.
- The rate of change for the total cost to rent a conference room is described by the expression . A ratio with the expression 12,500 minus 2,500 for its numerator 5 for its denominator
Question 20.
Use the diagram below to answer the question that follows.

A collection of unit cubes is shown arranged within the edges of a rectangular prism in three rectangular layers. The bottom layer is 5 cubes wide by 6 cubes long, the middle layer is 4 cubes wide by 5 cubes long, and the top layer is 3 cubes wide by 4 cubes long.
A rectangular prism has been partially filled with unit cubes. Which of the following expressions represents the number of unit cubes needed to finish filling the box?
- 2 times 5 plus 2 times 6
- 3 times 4 plus 3 times 4
- 90 minus 5 times the sum of 6 and 4 minus the product of 3 and 4
- 90 minus the product of 6 and 5 minus 5 times open paren 4 minus 3 close paren.
Question 21.
Use the diagram below to answer the question that follows.
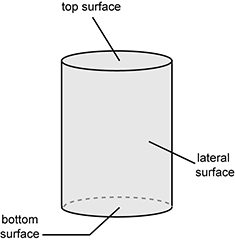
A cylinder is shown. Its top circular face is labeled top surface, its bottom circular face is labeled bottom surface, and the curved surface connecting these faces is labeled lateral surface.
A teacher plans to introduce students to the surface area of a cylinder. Which of the following claims is most appropriate for the teacher to make?
- The lateral surface area is equal to the area of a rectangle.
- The lateral surface area is equal to the surface area of a prism.
- The total surface area is a sum of the areas of two circles and the length of the circumference of the lateral surface.
- The total surface area is equal to the product of the length of one of the radii and the height of the lateral surface.
Question 22.
Earth's diameter is approximately 7,918 miles and pie is approximately equal to 3.14. What is the approximate circumference of the Earth?
- 100,000 miles
- 50,000 miles
- 25,000 miles
- 12,000 miles
Question 23.
Quadrilateral A B C D is graphed in the coordinate plane with vertices A at two comma 0, B at negative 2 comma negative 3, C at 1 comma negative 6, and D at 5 comma negative 3. Which of the following descriptions of A B C D is accurate?
- A B C D is a parallelogram.
- A B C D is a square.
- A B C D is a rectangle.
- A B C D is a kite.
Question 24.
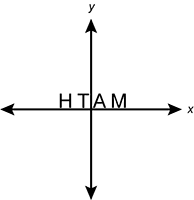
Use the graph below to answer the question that follows.
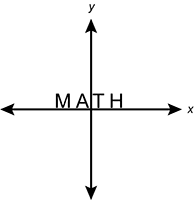
The word MATH appears on a blank coordinate plane. The letters appear in the top half of the coordinate plane and the bottoms of the letters touch the x-axis. The word is centered about the y-axis.
The word MATH appears in the coordinate plane as shown above. Which of the following graphs shows how the word could appear after being translated?
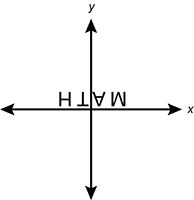
- The word MATH appears backwards on a blank coordinate plane. The letters appear in the top half of the coordinate plane and the bottoms of the letters touch the x-axis. The word is centered about the y-axis.
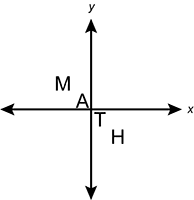
- The word MATH appears upside down and backwards on a blank coordinate plane. The top of each letter is positioned just above the x-axis and the word is centered about the y-axis.
- The word MATH appears sloping downward from left to right. The letters M and A are above the origin and to its left. The letters T and H are below the origin and to its right.
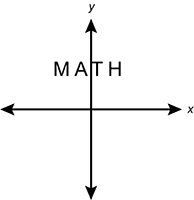
- The word MATH appears in the middle of the top half of the coordinate plane and is centered about the y-axis.
Question 25.
Use the figure below to answer the question that follows.
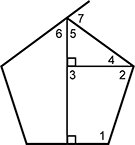
A regular pentagon is shown with its bottom edge oriented horizontally. A vertical line segment extends from the midpoint of the bottom edge to the vertex directly above it. A horizontal line segment extends from that vertical line segment at a right angle and intersects the rightmost vertex. Additionally, the edge extending from the leftmost vertex extends slightly past the top vertex of the pentagon.
Several angles are labeled within the pentagon. They are:
Angle 1, the interior angle at the bottom right vertex
Angle 2, formed by the horizontal interior line segment and the edge connecting the rightmost vertex and the bottom right vertex.
Angle 3, appearing directly to the left of angle 2, formed by the intersection of two interior line segments.
Angle 4, formed by the horizontal interior line segment and the edge connecting the rightmost vertex and the top vertex. Angles 2 and 4 together form the interior angle of the rightmost vertex.
Angle 5, formed by the vertical interior line segment and the edge connecting the rightmost vertex and the top vertex.
Angle 6, formed by the vertical interior line segment and the edge connecting the leftmost vertex and the top vertex. Angles 5 and 6 together for the interior angle of the top vertex.
Angle 7, formed by the line segment extending from the leftmost vertex through the top vertex and the line segment connecting the rightmost vertex to the top vertex.
Given these lines and angles, the interior of the pentagon can be decomposed into 3 shapes: a quadrilateral with angles 1, 2, 3, and a right angle; a triangle with angles 4, 5, and a right angle, and another quadrilateral to the left of the vertical interior line segment.
Which of the following statements about the regular pentagon shown is true?
- Angle 6 is congruent to angle 7
- The measure of angle 3 minus the measure of angle 5 equals 145 degrees.
- Angle 2 is congruent to angle 7
- The measure of angle 1 plus the measure of angle 6 equals 180 degrees.
Question 26.
A sample of 1800 grains from a particular variety of rice weighs about one ounce. Which of the following values represents the best estimate of the number of grains that would be found in one pound of this rice?
- 18,000
- 28,800
- 115,200
- 180,000
Question 27.
Use the histogram below to answer the question that follows.
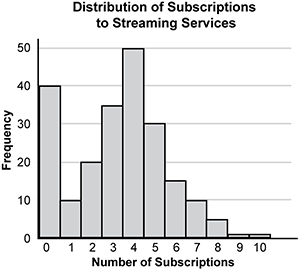
A histogram titled Distribution of Subscriptions to Streaming Services is shown. The horizontal axis is labeled Number of Subscriptions and the vertical axis is labeled Frequency. The data values are 0 comma 40; 1 comma 10; 2 comma 20; 3 comma 35; 4 comma 50; 5 comma 30; 6 comma 15; 7 comma 10; 8 comma 5; 9 comma 1; and 10 comma 1.
A person conducted a marketing survey to determine how many subscriptions people have with different streaming services. The results of the survey are shown in the histogram. Which of the following conclusions about the group of people who were surveyed is best supported by the data?
- 40% of the people subscribe to at least 7 services.
- 40% of the people do not subscribe to any services.
- More than 40% of the people subscribe to 4 services.
- More than 40% of the people subscribe to fewer than 5 services.
Question 28.
Use the table below to answer the question that follows.
| Hours After Opening | Number of People Who Entered | Number of People Who Exited |
|---|---|---|
| 1 | 150 | 10 |
| 2 | 175 | 25 |
| 3 | 350 | 75 |
| 4 | 500 | 200 |
| 5 | 350 | 400 |
An amusement park tracks the number of customers that enter and exit its park every hour for 5 hours and records the data in the table shown. There are no customers in the park before the start of hour 1. How many customers are in the park after the park has been open for 5 hours?
- 815
- 915
- 1,525
- 2,235
Question 29.
Which of the following graphs is most appropriate to use to assess the mode in a set of data?
- Venn diagram
- dot plot
- line graph
- box plot
Question 30.
Use the graph below to answer the question that follows.
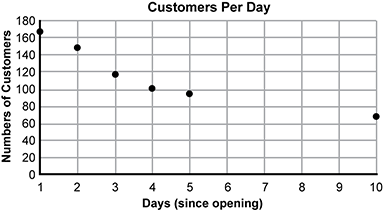
A graph titled Customers Per Day is shown with a horizontal axis labeled days open paren since opening close paren and a vertical axis labeled Number of Customers. 6 data points are shown in the graph at coordinates 1 comma 168, 2 comma 147, 3 comma 119, 4 comma 102, 5 comma 99, and 10 comma 70.
A new business tracks the number of customers per day since the business opened. The business owner did not collect data from the 6th day through the 9th day. Given the data shown in the graph, what is the most reasonable estimate of the number of customers on the 7th day since the business opened?
- 108
- 78
- 43
- 24
Question 31.
Use the histogram below to answer the question that follows.
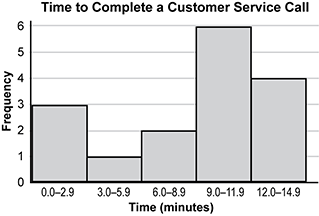
A histogram titled Time to Complete a Customer Service Call is shown. The horizontal axis shows different time intervals in minutes and the vertical axis shows frequency of the number of calls in that interval. The frequency from 0 point 0 to 2 point 9 is 3; from 3 point 0 to 5 point 9 is 1; from 6 point 0 to 8 point 9 is 2; from 9 point 0 to 11 point 9 is 6; from 12 point 0 to 14 point 9 is 4.
The time it takes a customer service agent to complete a phone call with a customer is recorded to the nearest tenth of a minute. Call times for a sample of that agent's phone calls are shown in the histogram. Given the data shown, what is the probability that the agent's next phone call will be 6 minutes or longer?
- 16.6%
- 25%
- 62.5%
- 75%
Question 32.
The rise and fall of Earth's tides is primarily caused by the effects of which of the following phenomena?
- ocean currents circulating water throughout the seas on Earth
- the Moon and Sun's gravitational forces being exerted on Earth
- surface winds producing uneven heating on Earth's surface
- severe weather conditions driving pressure changes on Earth's surface
Question 33.
A fourth-grade class observes a time-lapse video of a rock structure that borders a river. The video shows continuously flowing water and moving ice chunks striking the rocks. This video illustrates the effects of which of the following natural processes on the rock structure?
- chemical weathering
- deposition
- flooding
- erosion
Question 34.
Students attending a school near a large river observe workers removing sediment and debris that have built up along the riverbank over time. For which of the following types of natural events are the workers most likely preparing?
- blizzard
- flood
- drought
- tsunami
Question 35.
A town is watering high-traffic pavement, creating artificial shade, and installing green roofs to town buildings. The town is most likely preparing for which of the following natural events?
- extreme heat
- windstorms
- frequent wildfires
- drought conditions
Question 36.
Fifth-grade students work in groups to create filtration systems to filter particles from running water. The students draw a schematic and create a prototype of their group's filtration system. Which of the following activities would best incorporate the science and engineering practice of applying mathematical concepts into the project?
- averaging the amount of water each student uses at home in a day
- calculating the amount of water that their system can filter in an hour
- estimating the cost of building a larger version of each of the filters
- counting the number of large particles their filter removes from the water
Question 37.
To better understand the water cycle, fifth-grade students are creating their own diagrams that are complete with precise scientific vocabulary. Which of the following science and engineering practices does this activity most directly allow the students to experience?
- developing and using models
- engaging in argument from evidence
- planning and carrying out investigations
- analyzing and interpreting data
Question 38.
Students place an identical amount of water in three cups and draw a line at the water level. One cup is covered with plastic wrap, one cup is covered with dark construction paper, and one cup is left open. All three cups are left on a windowsill in the sunshine, each receiving the same amount of light during the day. In order for students to best investigate evaporation, which of the following activities should be performed the next day?
- setting up the investigation again with indicator dye in the cups
- measuring the temperature of the water in of each of the cups
- identifying the amount of moisture on the sides of the cups
- comparing the levels of water in each of the cups
Question 39.
Which of the following situations represents a parasitic relationship between organisms?
- A spider traps and paralyzes an insect to consume it for nutrients.
- A species of bacteria present in the intestine of a cow provides nutrients to the cow by breaking down ingested food.
- Fleas living on a dog bite it to obtain nutrients from their host's blood.
- A clownfish living among an anemone's tentacles provides nutrients to its host through its waste.
Question 40.
Which of the following animals decompose organic matter and recycle nutrients back into an ecosystem?
- owls
- snakes
- catfish
- earthworms
Question 41.
Which of the following structures is primarily responsible for absorbing water in most plants?
- stem
- flowers
- roots
- leaves
Question 42.
Flash floods, volcanic eruptions, and rapid burials of marine organisms are all events that could help perform which of the following actions?
- causing the evolution of new species
- reshaping eroded landscapes
- renewing buried plant life
- creating fossil records
Question 43.
Leaves and other plant material are decomposing in a pile underneath a fallen log in the forest. Which of the following types of organisms is most responsible for the pile's change from recognizable plant matter to forest soil?
- beetles
- large mammals
- bacteria
- small rodents
Question 44.
Which of the following types of interactions between two species in an ecosystem benefits one species but has no effect on the other?
- commensalism
- parasitism
- mutualism
- predation
Question 45.
A third-grade class plants a variety of flower seeds in containers in the classroom. The students observe the flowers' stages of growth throughout the school year. Which of the following activities would best integrate the science and engineering practice of applying mathematical concepts into this investigation?
- describing the factors that help the plants achieve certain heights
- explaining numerically the genetic characteristics of the fully grown plants
- creating a graphical representation of the growth of each plant
- drawing a model of what a given plant's height will look like months in the future
Question 46.
In which of the following scenarios does a chemical reaction take place?
- A sugar cube placed into hot tea is no longer visible after the tea is stirred for several seconds.
- A liquid inside a container expands after it is put in a freezer.
- A white residue forms inside a bowl as salt water in the bowl evaporates over several days.
- A cut apple turns brown after being exposed to air for an hour.
Question 47.
Which of the following statements best describes what happens to atoms involved in a chemical reaction?
- The total number of atoms decreases as new substances form.
- Old atoms are replaced by newly created atoms.
- The number of atoms stays the same but they may be arranged differently.
- Atoms fuse to form a new type of atom.
Question 48.
Sodium chloride, also known as table salt, is an example of:
- a compound.
- an element.
- a mixture.
- an atom.
Question 49.
While baking, a student held a raw egg in their hand. The egg slipped out of the student's hand and broke on the floor. At which point was the egg's potential energy the greatest?
- during free fall
- at the moment of impact
- while in the student's hand
- after the collision with the floor
Question 50.
Earth revolves around the Sun, and the Moon revolves around Earth. These phenomena can be attributed to the relationship between:
- size and shape.
- mass and gravity.
- inertia and revolution.
- density and acceleration.
Question 51.
A teacher creates a solution of 5 grams of water and 4 grams of hydrogen peroxide. These reactants go through a chemical reaction as they are mixed. What is the total mass of the solution after this occurs?
- 1 gram
- 4 grams
- 5 grams
- 9 grams
Use the information below to answer the two questions that follow.
Students are experimenting with a guitar and determine that plucking a certain string produces a sound with an original frequency of 440 hertz. The students discover that the frequency of the sound increases if they touch the string to a fret when they pluck it. Touching the string to fret position 1 increases the frequency of its sound by approximately 8% of its original frequency. Moving down to each successive fret increases the frequency by an additional 8% of the original frequency.
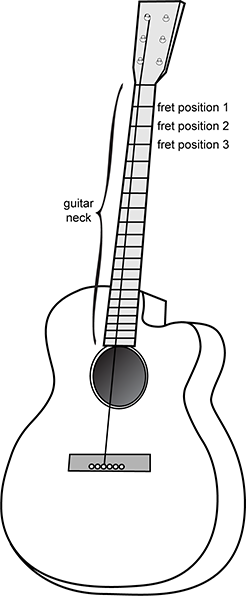
A guitar is shown with a single string attached to connectors above its neck and in the middle of its body. A series of horizontal lines along the neck of the guitar represent frets. The first fret from the top part of the neck is labeled fret position 1. The next 2 frets that follow are labeled fret position 2 and fret position 3.
Question 52.
What is the new frequency of the sound produced by plucking the string if it is depressed at fret position 3?
- 448 hertz
- 464 hertz
- 475.2 hertz
- 545.6 hertz
Question 53.
Plucking the string harder or softer would change which of the following characteristics of the sound wave produced?
- amplitude
- wavelength
- frequency
- period
Question 54.
A certain metal that can be physically bent without breaking would have a high level of:
- length.
- ductility.
- elasticity.
- hardness.
Question 55.
A group of students created a prototype for a durable cellphone case. An initial testing of the prototype resulted in the phone slipping out of the case. Incorporating which of the following materials into the cellphone case would best protect the phone?
- glass
- rubber
- metal
- sandpaper
Question 56.
A group of students created a model during an engineering design activity that did not perform as effectively as they had anticipated. Which of the following steps would be most appropriate for the students to take next?
- researching similar studies to validate the conclusions
- starting the investigation over from the beginning
- making adjustments to meet the parameters of the problem
- repeating the investigation to replicate the results
Question 57.
A third-grade class had a cabinet hinge break in their classroom. As a result, the cabinet's door no longer latches to the frame. The students brainstorm ideas to fix the door. One group creates a prototype that uses magnets to secure the pieces. Which of the following constraints to the experiment could hinder the design process?
- gaining permission to complete the project using the magnets
- obtaining magnets strong enough to achieve the goal
- aligning the magnets so they attract instead of repel
- learning the fundamentals of electromagnetism
Question 58.
A group of students created designs for a new water purification system inside the school. The students developed blueprints and a small-scale prototype. Which of the following constraints would pose the greatest challenge for the students at this point of the process?
- addressing ethical considerations related to completing the prototype
- identifying why water purification is a problem for the school
- acquiring the appropriate knowledge to create the prototype
- funding a large-scale project within the school
Question 59.
A fourth-grade class is investigating heat transfer in everyday interactions. The teacher models a scenario to show conduction using a metal spoon, a standard cooking pot, and a quart of water. Which of the following items would be most appropriate for the teacher to use to complete this demonstration?
- a cooler
- a candle
- a hot plate
- a working refrigerator
Question 60.
A fourth-grade class is investigating ways to communicate through decoding a pattern. The students invent the pattern to use and then design an apparatus to deliver the communication. Two groups of students present their designs to each other and then share feedback with one another. According to the engineering design process, which of the following steps should each group take next?
- replicating the other group's design
- creating the final product based on the design
- creating an entirely new design using their peers' suggestions
- improving their design based on their peers' suggestions
Open-Response Item
The directions shown below represent what you will see on the actual test. For the purposes of this practice test, you will be able to type your written response in the box provided on the answer key.
This section of the test consists of an open-response item assignment. You will be asked to prepare a written response of approximately 150 to 300 words, or 1 to 2 pages, for the assignment.
Read the assignment carefully before you begin your response. Think about how you will organize your response. You may use the erasable sheet(s) to make notes, write an outline, or otherwise prepare your response. However, your final response to the assignment must be either:
- typed into the on-screen response box,
- written on a response sheet and scanned using the scanner provided at your workstation, or
- provided using both the on-screen response box (for typed text) and a response sheet (for calculations or drawings) that you will scan using the scanner provided at your workstation.
Instructions for scanning your response sheet(s) are available by clicking the "Scanning Help" button at the top of the screen.
As a whole, your response to the assignment must demonstrate an understanding of the knowledge of the field. In your response to the assignment, you are expected to demonstrate the depth of your understanding of the subject area by applying your knowledge rather than by merely reciting factual information.
Your response to the assignment will be evaluated based on the following criteria.
- Purpose: the extent to which the response achieves the purpose of the assignment
- Subject Knowledge: appropriateness and accuracy in the application of subject knowledge
- Support: quality and relevance of supporting evidence
- Rationale: soundness of argument and degree of understanding of the subject area
The open-response item assignment is intended to assess subject knowledge. Your response must be communicated clearly enough to permit valid judgment of the evaluation criteria by scorers. Your response should be written for an audience of educators in this field. The final version of your response should conform to the conventions of edited American English. Your response should be your original work, written in your own words, and not copied or paraphrased from some other work.
Be sure to write about the assigned topic. You may not use any reference materials during the test. Remember to review your work and make any changes you think will improve your response.
Any time spent responding to the assignment, including scanning the response sheet(s), is part of your testing time. Monitor your time carefully. When your testing time expires, a pop-up message will appear on-screen indicating the conclusion of your test session. Only response sheets that are scanned before you end your test or before time has expired will be scored. Any response sheet that is not scanned before testing ends will NOT be scored.
Question 61.
Use the information that appears in the exhibits to complete the assignment that follows.
Using your knowledge of life science, as well as your knowledge of representing and interpreting data, analyze the information provided and write a response of approximately 150 to 300 words, or 1 to 2 pages, in which you:
- Calculate and then compare the median heart rate before physical activity and the median heart rate after physical activity. Be sure to show the steps you used to arrive at your answer.
- Explain the relationship between the circulatory and respiratory system that results in the changes observed in the table due to physical activity.
Exhibit
Students are investigating the interaction of the human circulatory and respiratory systems. Students work in groups of three: one student acts as the subject, one student measures the subject's breathing rate, and one student measures the subject's heart rate. First, the students measure the breathing and heart rates while the subject is standing at rest. Next, the subject runs in place for 1 minute. Immediately following this physical activity, the students measure and record the subject's heart rate and breathing rate again. Data obtained by 10 student groups for their 10 different subjects are shown in the table below.
| Before Physical Activity | After Physical Activity | |||
|---|---|---|---|---|
| Respiratory Rate (breaths per minute) | Heart Rate (beats per minute) | Respiratory Rate (breaths per minute) | Heart Rate (beats per minute) | |
| Group 1 | 28 | 68 | 37 | 128 |
| Group 2 | 15 | 72 | 21 | 160 |
| Group 3 | 19 | 60 | 35 | 150 |
| Group 4 | 17 | 68 | 24 | 140 |
| Group 5 | 30 | 70 | 54 | 132 |
| Group 6 | 28 | 66 | 48 | 123 |
| Group 7 | 32 | 61 | 55 | 115 |
| Group 8 | 21 | 56 | 45 | 120 |
| Group 9 | 28 | 72 | 40 | 142 |
| Group 10 | 25 | 62 | 38 | 130 |