Practice Test: Mathematics (63)
Suggested Testing Time: 4 hours
To Take This Practice Test
- Use the answer key to record your responses.
- Prefer to take it offline? You can print the questions and answer key.
Remember:
- The practice test can give you a good indication of how you may perform on an actual test, but there is no guarantee that your results will be the same as on the actual test.
- The actual test looks and operates differently than this practice test. In addition, this test includes one or more assignments that allow you to handwrite and scan your responses. Review the Testing Tutorials and Demonstrations for more information about the actual test platform.
- A scientific calculator
 and formulas are provided on-screen with your actual test.
Question 1.
The owner of a T-shirt shop bought a shipment of shirts, each for the same cost, and sold the shirts in the shop for 20% above cost. At the end of the season, not all the shirts had been sold. The owner sold the remaining shirts for the sale price of buy one and get the second shirt for half price, resulting in a loss on the sale of each of these shirts. The loss per shirt for these remaining shirts was what percentage of the owner's original cost per shirt?
- 5%
- 10%
- 20%
- 25%
Question 2.
The resistance, R, in ohms, of a wire is given by the formula R equals p times l all divided by A , where ρ is the resistivity of the material used to make the wire, l is the length of the wire, and A is its cross-sectional area. What is the resistance of a wire for which p equals 1.75 times ten to the negative sixth power ohm centimeters, l equals 250 centimeters, and A equals 3.5 times ten to the negative third power square centimeters? ?
- 1.25 times ten to the negative seventh power ohms
- 1.25 times ten to the negative first power ohms
- 1.25 times ten to the first power ohms
- 1.25 times ten to the fourth power ohms
Question 3.
A community group is organizing a dinner. Local florists will donate 128 carnations, 160 lilies, and 16 dozen roses to be put into floral arrangements for the tables. All the arrangements will be identical and all the flowers will be used. In order to create the greatest number of arrangements possible, how many flowers will be in each arrangement?
- 15 flowers
- 16 flowers
- 30 flowers
- 32 flowers
Question 4.
Use the computation below to answer the question that follows.

The letters a, b, c, d, and e represent the specific digits of the numbers involved in the long division computation above. The letters a, b, c, d, and e are not variables.
Which of the following equations correctly represents this computation?
- b, a, e divided by d equals c, d, point b
- b, a, e divided by d equals c d plus b
- b, a, e divided by d equals c d plus b over d
- b, a, e divided by d equals c d plus b over b, a, e
Question 5.
Which of the following values is the best approximation for the area of a rectangle with length The square root of 3 plus the square root of 5 inches and width The square root of 3 inches?
- 5 square inches
- 6 square inches
- 7 square inches
- 8 square inches
Question 6.
Use the sequence below to answer the question that follows.
The Mandelbrot Sequence
first term is c. second term is c squared plus c. third term is c squared plus c the quantity squared plus c. The fourth term is open bracket open parentheses c squared plus c closed parentheses the quantity squared plus c closed bracket the quantity squared plus c.When c = i, how many of the first four terms of this sequence have a nonzero real part?
- 1
- 2
- 3
- 4
Question 7.
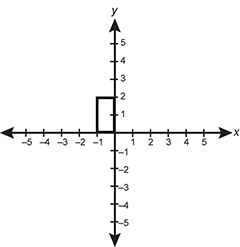
Use the graph below to answer the question that follows.
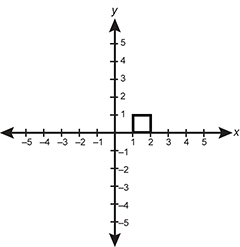
Which of the following graphs results from using the linear transformation matrix  on the graph above?
-
 A rectangle is graphed in the coordinate plane with vertices at 1 0, 1 negative 1, 3 negative 1, and 3 0.
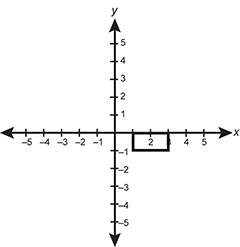
-
 A rectangle is graphed in the coordinate plane with vertices at 2 0, 2 negative 1, 4 negative 1, and 4 0.
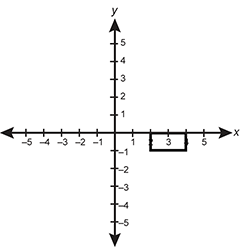
-
 A rectangle is graphed in the coordinate plane with vertices at negative 1 0, negative 1 2, negative 2 0, and negative 2 2.
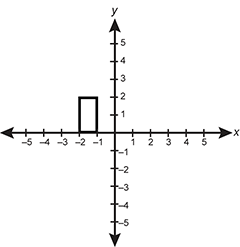
-
 A rectangle is graphed in the coordinate plane with vertices at 0 0, 0 2, negative 1 2, and negative 1 0.
Question 8.
A boat starts from a dock located at the point (0, 0) and travels in the direction of the point (3, 4) at 25 miles per hour for 2 hours. Then the boat heads straight toward an island located at the point (50, 48). If each unit represents 1 mile, which of the following vectors represents the direction of the boat when it heads toward the island?
- (1, 1)
- (5, 2)
- (10, 11)
- (11, 10)
Question 9.
Use the matrices below to answer the question that follows.
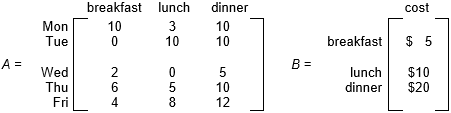
Matrix A is a 5 x 3 matrix with rows labeled Monday, Tuesday, Wednesday, Thursday, and Friday from top to bottom. The columns are labeled breakfast, lunch, and dinner from left to right. The elements in the matrix are described as follows by row, from left to right: Row 1 contains 10, 3, 10. Row 2 contains 0, 10, 10, Row 3 contains 2, 0, 5, Row 4 contains 6, 5, 1, and Row 5 contains 4, 8, 12. Matrix B is a 3 by 1 matrix with rows labeled breakfast, lunch, and dinner from top to bottom, and the column is labeled cost. The matrix contains the elements 5 dollars, 10 dollars, and 20 dollars from top to bottom.
Matrix A represents the numbers of breakfasts, lunches, and dinners served on each of five consecutive days. Matrix B represents the cost of each breakfast, lunch, and dinner. Which of the following is represented by the product of matrix A and matrix B?
- the total costs of all meals combined for each day
- the total costs for each type of meal on each day
- the total costs for each type of meal for the entire five days
- the total cost of all meals combined for the entire five days
Question 10.
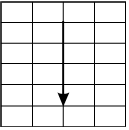
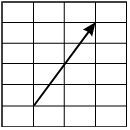
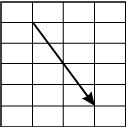
Use the diagram below to answer the question that follows.
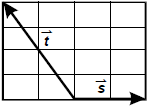
Two vectors are shown in the first quadrant of the coordinate plane. Vector t begins at the point 2, 0 and ends with an arrow at the point 1, 4. Vector s begins at the point 2, 0 and ends with an arrow at 4, 0.
Which of the following vectors represents  ?
?
-
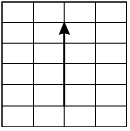 A vector is shown in the first quadrant of the coordinate plane that begins at the point 2, 1 and ends with an arrow at 2, 5.
-
 A vector is shown in the first quadrant of the coordinate plane that begins at the point 2, 5 and ends with an arrow at the point 2, 1.
-
 A vector is shown in the first quadrant of the coordinate plane that begins at the point 1, 1 and ends with an arrow at the point 3, 5.
-
 A vector is shown in the first quadrant of the coordinate plane that begins at the point 1, 5 and ends at the point 3, 1.
Question 11.
Given that x is greater than 1, which of the following expressions is equivalent to the quotient of the expression x to the negative first power minus x divided by the expression x to the negative second power minus x squared?
- 1 divided by the expression 1 plus x squared
- X divided by the expression 1 plus x squared
- X squared minus 1 all divided by x
- X squared plus 1 all divided by x
Question 12.
As part of a service project, a high school student organizes a dance show to raise money for a local charity. Youth tickets, Y, sell for 6 dollars each and adult tickets, A, sell for 9 dollars each. Which of the following algebraic sentences represents the student's goal of collecting at least 1 thousand 8 hundred dollars in ticket sales?
- A is greater than or equal to negative two thirds y plus 200
- A is greater than or equal to negative 3 halves y plus 300
- A is greater than or equal to negative 6 y plus 200
- A is greater than or equal to negative 9 y plus 300
Question 13.
Use the partially completed two-column proof below to answer the question that follows.
Given: a real number a where A is not equal to 0, a squared equals a
Prove: a = 1
| Statement | Reason |
|---|---|
| 1. A is not equal to 0, a squared equals a | 1. Given |
| 2. A squared equals a times a | 2. Definition of squaring |
| 3. A times a equals a | 3. Substitution property of equality |
| 4. Open parentheses a times a closed parentheses times 1 over a equals a times 1 over a. | 4. Multiplication property of equality |
| 5. A times the quantity a times 1 over a equals a times 1 over a | 5. blank |
| 6. A times 1 equals 1 | 6. Multiplicative inverse property |
| 7. a = 1 | 7. Multiplicative identity property |
 a •
a •  = a •
= a • Which property is the missing reason in step 5?
- Commutative property
- Associative property
- Distributive property
- Transitive property
Question 14.
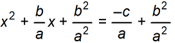
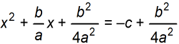
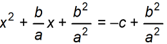
Given A x squared + b x plus c equals 0 , which of the following equations is a step in solving for x by completing the square?
-
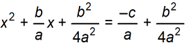 x squared + b divided by A times x + b squared divided by 4 A squared equals negative c divided by A + b squared divided by the 4 A squared.
-
 x squared + b divided by A times x + b squared divided by A squared equals negative c divided by A + b squared divided by A squared.
-
 x squared + b divided by A times x + b squared divided by 4 A squared equals negative c + b squared divided by 4 A squared.
-
 x squared + b divided by A times x + b squared divided by A squared equals negative c plus b squared divided by A squared.
Question 15.
A polynomial with real coefficients, P of x , is degree 4 and has roots that include negative 2 and 3 plus I . Which of the following expressions must be a quadratic factor of P of x ?
- x squared minus 4
- x squared plus 4 x plus 4
- x squared minus 6 x minus 8
- x squared minus 6 x plus 10
Question 16.
The solution to which of the following inequalities is x such that x < negative 11 or x > 5 ?
- x squared + 6x minus 55 greater than 0
- x squared + 6x minus 55 less than 0
- x squared minus 6x minus 55 greater than 0
- x squared minus 6x minus 55 less than 0
Question 17.
Use the diagram below to answer the question that follows.
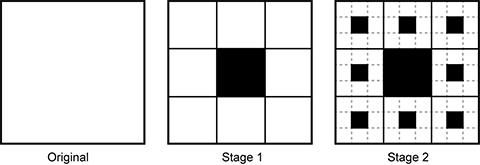
A self-similar pattern is shown using a square, which is referred to as the original. In stage 1, the original square is divided into 9 smaller, congruent squares using 2 vertical lines and 2 horizontal lines and the center square is filled in black. In Stage 2, the eight squares surrounding the black square from Stage 1 are each divided into 9 smaller squares with the center squares filled in black.
A square is divided into 9 congruent squares and the center square is shaded, as shown in the diagram. Then, each of the unshaded squares is divided into 9 congruent squares and the center square is shaded. If this process continues, which of the following expressions represents the fraction of the original square that will be shaded?
-
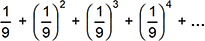 An infinite series is shown with a first term of one ninth, a second term of one ninth squared, a third term of one ninth cubed, and a fourth term of one ninth to the fourth power.
-
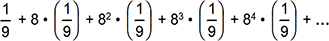 An infinite series is shown with a first term of one ninth, a second term of eight times one ninth, a third term of 8 squared times one ninth, a fourth term of 8 cubed times one ninth, and a fifth term of 8 to the fourth power times one ninth.
-
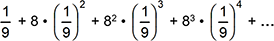 An infinite series is shown with a first term of one ninth, a second term of eight times one ninth squared, a third term of eight squared times one ninth cubed, and a fourth term of 8 cubed times one ninth to the fourth.
-
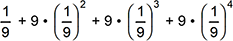 A series is shown with a first term of one ninth, a second term of nine times one ninth squared, a third term of nine times one ninth cubed, and a fourth term of nine times one ninth to the fourth power
Question 18.
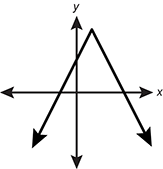
Use the graph below to answer the question that follows.
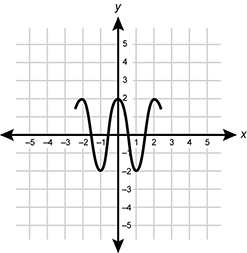
A periodic function is graphed in the coordinate plane on the interval from negative 2.5 to 2.5. The graph is symmetrical about the y axis, with a relative maximum at 0, 2. The graph has an amplitude of 2 and a wavelength of 2
The graph shows a periodic function f of x that has a domain of all real numbers. If the pattern continues for the entire domain, the value of the function at x = 35 over 2 is the same as the value of the function at:
- x = 1 third.
- x = 1.
- x = 3 halves.
- x = 2.
Question 19.
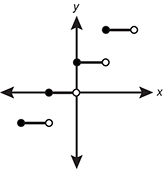
Which of the following relations is a function?
-
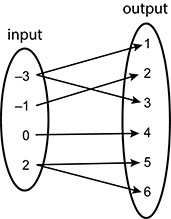 A mapping diagram shows the inputs negative 1, negative 3, 0, and 2 mapped to the outputs 1, 2, 3, 4, 5, and 6 such that 3 is mapped to one and 3, -1 is mapped to 2, 0 is mapped to 4, and 2 is mapped to 5 and 6.
- A set of coordinate points contains the points 4 2, 9 3, 4 negative 2, and 25 negative 5.
-
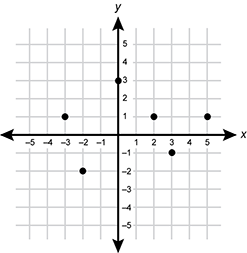 The following discrete points are mapped on a coordinate grid: negative 3 1, negative 2 negative 2, 0 3, 2 1, 3 negative 1, and 5 1.
- The set of all points, x y, such that y squared is equal to x plus 1.
Question 20.
Given the functions f of x equals x squared plus 2 x plus 5, g of x equals radical x, and h of x = g of f of x which of the following statements describes the range of h of x ?
- h of x is greater than or equal to 0
- h of x is greater than or equal to 2
- h of x is greater than or equal to radical 5
- h of x is any real number.
Question 21.
Which of the following statements correctly relates a function f of x and its inverse, f inverse of x ?
- If f of x equals x plus 2, then f inverse of x equals 2 minus x
- If f of x equals x squared, then f inverse of x equals 2 to the power of x
- If f inverse of x is the inverse of f of x, then f of f inverse of x equals f inverse of f of x which equals x
- If f inverse of x is the inverse of f of x, then f of f inverse of x equals f inverse of f of x which equals 1
Question 22.
For what values of m will the graphs of y = m x + 3 and y = negative x squared + 3 x + 2 have no points of intersection?
- negative 5 is less than m is less than negative 1
- 1 is less than m is less than 5
- m is less than negative 5 or m is greater than negative 1
- m is less than 1 or m is greater than 5
Question 23.
An absolute value function of the form y = c + the absolute value of the quantity x + b passes through the points (–6, 13) and (16, 15). What is the location of the vertex for this function?
- (0, 7)
- (4, 3)
- (5, 14)
- (8, 23)
Question 24.
Use the function below to answer the question that follows.
f of x = 2 x squared minus 24 x + 6
What is the maximum value of f of x on the interval negative 3 is less than or equal to x is less than or equal to 5
- 176
- 96
- negative 64
- negative 66
Question 25.
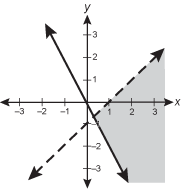
Use the inequalities below to answer the question that follows.
2 x plus y is greater than or equal to 0. X minus y is less than 1
Which of the following graphs shows the solution to the system of linear inequalities?
-
 The dotted line x minus y equal to 1 and the solid line 2x + y is equal to 0 are graphed in the coordinate plane. The rightmost region defined by the intersection of the two lines of is shaded gray
-
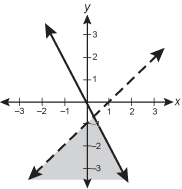 The dotted line x minus y is equal to 1 and the solid line 2x + y is equal to 0 are graphed in the coordinate plane. The lower region defined by the intersection of the two lines of is shaded gray
-
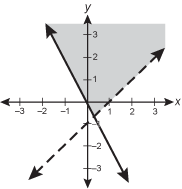 The dotted line x minus y is equal to 1 and the solid line 2x + y is equal to 0 are graphed in the coordinate plane. The upper region defined by the intersection of the two lines of is shaded gray
-
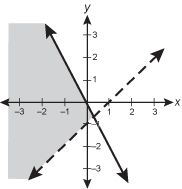 The dotted line x minus y is equal to 1 and the solid line 2x + y is equal to 0 are graphed in the coordinate plane. The leftmost region defined by the intersection of the two lines of is shaded gray
Question 26.
Use the table below to answer the question that follows.
| product type | profit (dollars) |
prep time (hours) |
bake time (hours) |
| bagels (b) | 60 | 2 | 3 |
| pretzels (p) | 50 | 4 | 1 |
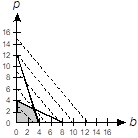
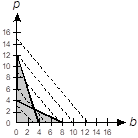
The manager of a commercial bakery uses the table above to optimize the profitability of the bakery. The bakery's preparation room can operate for up to 16 hours per day and its baking facility can run for up to 12 hours per day. If b represents thousands of bagels and p represents thousands of pretzels, which of the following graphs represents the linear programming problem?
-
 The first quadrant of a coordinate plane is shown with a horizontal axis labeled b and a vertical axis labeled p. Two line segments are drawn, one with endpoints at 0 4 and 8 0, the other with endpoints at 4 0 and 0 12. The quadrilateral with vertices 0 0, 0 4, 4 0 and a fourth vertex at the intersection point of the lines, is shaded gray.
-
 The first quadrant of a coordinate plane is shown with a horizontal axis labeled b and a vertical axis labeled p. Two line segments are drawn, one with endpoints at 4 0 and 0 12, and another with endpoints at 8 0 and 0 4. The entire region bounded by the lines and the axes is shaded gray.
-
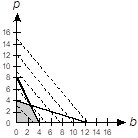 The first quadrant of a coordinate plane is shown with a horizontal axis labeled b and a vertical axis labeled p. Two line segments are drawn, one with endpoints at 0 4 and 12 0, the other with endpoints at 4 0 and 0 8. The quadrilateral with vertices 0 0, 0 4, 4 0 and a fourth vertex at the intersection point of the lines, is shaded gray.
-
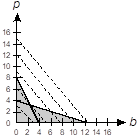 The first quadrant of a coordinate plane is shown with a horizontal axis labeled b and a vertical axis labeled p. Two line segments are drawn, one with endpoints at 0 8 and 4 0, the other with endpoints at 0 4 and 12 0. The entire region bounded by the lines and the axes is shaded gray.
Question 27.
A construction company purchases a piece of equipment for 42,000 dollars that decreases in value at the rate of 6% per year. Which of the following equations represents its value at the end of n years?
- V sub n equals 42,000 times 0.94 to the enth power
- V sub n equals 42,000 times 0.94 n
- V sub n equals 42,000 minus 42,000 times 0.06 to the enth power
- V sub n equals 42,000 minus 42,000 times 0.06 n
Question 28.
The points  and (0, 3) lie on the graph of an exponential function. What number is the base of this function?
-

- 2 thirds
-

- 3 halves
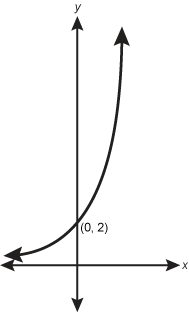
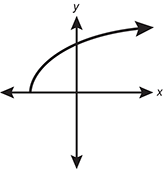
Question 29.
If f of x equals 2 raised to the 1 minus x power , which of the following graphs could represent its inverse, f inverse of x ?
-
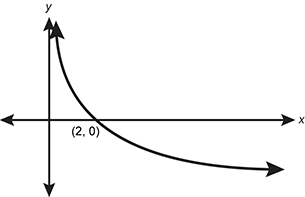 A logarithmic function is shown that intersects the x axis at 2 0. The function approaches infinity as x approaches zero and the function approaches negative infinity as x approaches infinity
-
 A logarithmic function is shown that intersects the y axis at 0 2. The function approaches 0 as x decreases and the function approaches infinity as x increases.
-
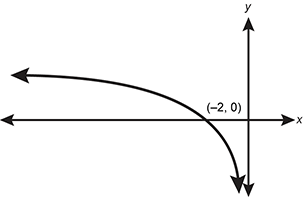 A logarithmic function is shown that intersects the x axis at negative 2 0. The function approaches infinity as x decreases and the function approaches negative infinity as x approaches 0.
-
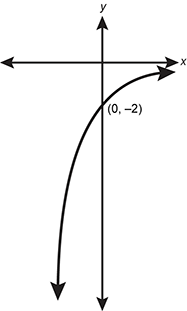 A logarithmic function is shown that intersects the y axis at 0 negative 2. The function approaches negative infinity as x decreases and the function approaches zero as x increases.
Question 30.
Which of the following statements describes intercepts and asymptotes of the function f of x equals base 4 log of the quantity x plus 2 ?
- It has intercepts at negative 1 0 and 0 one half and an asymptote at x equals negative 2
- It has intercepts at negative 1 0 and 0 negative 2 and an asymptote at x equals negative 2
- It has intercepts at negative 2 0 and 0 one half and an asymptote at x equals 2
- It has intercepts at negative 2 0 and 0 negative 2 and an asymptote at x equals 2
 , and an asymptote at x = −2.
Question 31.
Which of the following equations could be a step in solving the equation base 2 log of the quantity x minus 1 all divided by 5 = 1 for x?
- x minus 1 equals 5 squared
- 2 raised to the x minus 1 power equals 5
- x minus 1 equals 2 to the fifth power
- 5 raised to the x minus 1 power equals 2
Question 32.
If f of x equals 3 times 2 to the power of x and g of x equals log base 2 of one-third x what is f of g of x?
 , what is f(g(x))?
- 1
- x
-

-

Question 33.
Which of the following graphs best represents the rational function f of x equals 1 over the quantity x minus 2 plus 2
-
 A curve is shown in the coordinate plane that begins at a point on the negative x axis. The value of the function approaches infinity as x increases. The rate of change for the function is positive, and the rate of change decreases as x increases.
-
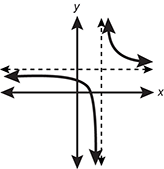 A function is shown with a horizontal asymptote at y = a and a vertical asymptote at x = b where the point a b is in the first quadrant. On the left, the function approaches a as x approaches negative infinity and the function approaches negative infinity as x approaches b. On the right, the function approaches infinity as x approaches b, and the function approaches a as x approaches infinity.
-
 A piecewise defined function is shown with intervals of horizonal lines segments defined by solid endpoints on the left and open circles on the right. The y values for the horizontal line segments increase in a stair step pattern as x increases.
-
 A function is shown with an absolute maximum at some point a b which is in the first quadrant. The function is symmetrical about the line x = b. The function approaches negative infinity, with a constant rate of change, on both the left and right of the vertex.
Question 34.
Use the graph below to answer the question that follows.
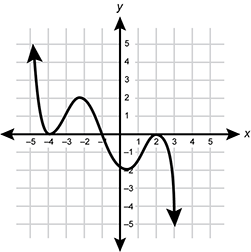
An odd polynomial function is graphed in the coordinate plane. The function has x intercepts at negative 4, negative 1, and 2. The function has a relative max in the interval from negative 4 to negative 1 and a relative minimum in the interval from negative 1 to 2.The function approaches infinity on the left and negative infinity on the right.
Which of the following polynomial functions could be represented by the graph?
- P of x equals negative 0.03 times the binomials x minus 4, x minus 1, and x plus 2
- P of x equals negative 0.03 times the binomials x plus 4, x plus 1, and x minus 2
- P of x equals negative 0.03 times the binomials x minus 4 the quantity squared, x minus 1, and x plus 2 the quantity squared
- P of x equals negative 0.03 times the binomials x plus 4 the quantity squared, x plus 1, and x minus 2 the quantity squared.
Question 35.
The graph of which of the following equations has a vertical asymptote at x = 2, a point of discontinuity at x = negative 1 , and horizontal asymptote y = 1 half?
- y = the binomial x plus 1 divided by the trinomial x squared minus 4 x minus 4
- y = the binomial x plus 1 divided by the trinomial 2 x squared plus 6 x plus 4
- y = the binomial x squared minus 1 divided by the trinomial x squared plus 4 x plus 4
- y = the binomial x squared minus 1 divided by the trinomial 2 x squared minus 2 x minus 4
Question 36.
A rectangle is drawn on the coordinate plane so that two of its vertices are on the x-axis and the other two vertices are above the x-axis and on the graph of the function y = 36 minus x squared . If the coordinates of the rectangle's vertex in the first quadrant are (x, y) and the area of the rectangle is 160 square units, which of the following equations could be solved to find x?
- negative 12 x squared + 272 = 0
- negative 12 x squared + 352 = 0
- x cubed minus 36 x + 80 = 0
- x cubed minus 36 x + 160 = 0
Question 37.
Use the equation below to answer the question that follows.
The trinomial x squared minus 2 x minus 15 divided by the binomial x squared minus 9 = 0
Which of the following is the complete solution to the equation above?
- x = plus or minus 3
- x = 5
- x = 5, or x = negative 3
- x = 5, or x = plus or minus 3
Question 38.
Use the table below to answer the question that follows.
| blank | f of 2 minus f of 1 | f of 3 minus f of 2 | f of 4 minus f of 3 | f of 5 minus f of 4 |
|---|---|---|---|---|
| f subscript 1 of x | 1 | 4 | 9 | 16 |
| f subscript 2 of x | 2 | 2 | 2 | 2 |
| f subscript 3 of x | 3 | 5 | 7 | 9 |
| f subscript 4 of x | 4 | 5 | 7 | 10 |
The table above shows the first differences of four functions. Based on their second differences, which of the following functions is quadratic?
- f subscript 1 of x
- f subscript 2 of x
- f subscript 3 of x
- f subscript 4 of x
Question 39.
A ray intersecting a unit circle is coincident with the terminal side of an angle of 8 pi divided by 3. Which of the following expressions represents secant 8 pi divided by 3 ?
- negative 2
- negative 1 half
-

-

Question 40.
The graph of y = sine x undergoes a transformation that places the minimum point of the new graph at 11 pi divided by 6, negative one half over the interval x is between 0 and 2 pi, inclusive . If there is no vertical shift or change in period, what are the amplitude and phase shift of the transformed graph?
- amplitude = 1 half, phase shift = one third pi to the right
- amplitude = 1 half, phase shift = 5 sixths pi to the right
- amplitude = 1, phase shift = one third pi to the right
- amplitude = 1, phase shift = 5 sixths pi to the right
Question 41.
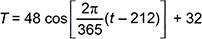
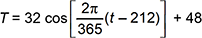
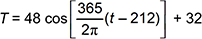
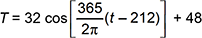
The average daily temperature T, in degrees Fahrenheit, for a certain city fluctuates from a low of 16 degrees to a high of 80 degrees . January 1 is day 1. The low of T occurs on January 30 (day 30) and the high of T occurs on July 31 (day 212). Assume that the average daily temperature can be modeled over the span of one year by a cosine function where T is the average daily temperature and t is the time in days, with t = 1 corresponding to January 1. Which of the following equations models the average daily temperature over one year for this city?
Question 42.
Which of the following expressions is equivalent to tangent squared x divided by the expression 1 plus tangent squared x?
- cosine squared x
- secant squared x
- sine squared x
- cosecant squared x
Question 43.
Which of the following equations could be a step in verifying the identity sine of x plus cosine of x times cotangent of x = cosecant of x ?
- sine squared x + sine x times cosine x times cotangent x = cosecant x
- sine squared x divided by sine x + cosine squared x divided by sine x = cosecant x
- tangent x + cotangent x = 1 over sine x
- sine squared x divided by sine x + cotangent x divided by sine x = cosecant x
Question 44.
Use the diagram below to answer the question that follows.
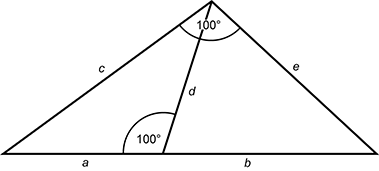
A triangle is shown with a 100 degree angle. A line segment, d, is drawn from the 100 degree angle to the opposite side which divides the opposite side into segments a and b, and forms a linear pair of angles with the angle between a and d measuring 100 degrees. Segment d creates two new triangles, a c d and b d e.
Which of the following equations can be deduced from the diagram?
- c b = a e
- a d = b d
- c e = a d + b d
- c d = a b + b squared
Question 45.
Use the diagram below to answer the question that follows.
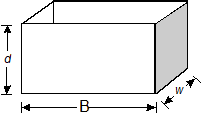
The container above has length B, width w, depth d, and volume V. A new container has a similar design except that the length is quadrupled, the width is doubled, and the depth is cut in half. Which of the following is equivalent to the volume of the new container?
- 1 half V
- V
- 4V
- 8V
Question 46.
Use the diagram below to answer the question that follows.
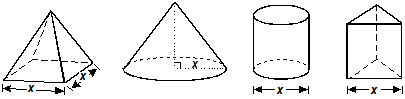
Four solids are shown: a square prism with a base area of x squared, a right cone with radius x, a right cylinder with diameter x, and a triangular prism with one side length of the triangular base measuring x.
The four solids shown above all have the same height. The square-based pyramid has base side length equal to x. The cone has base radius equal to x. The cylinder has base diameter equal to x. The equilateral triangle-based prism has base side length equal to x. Which solid has the greatest volume?
- pyramid
- cone
- cylinder
- prism
Question 47.
A cylindrical can is measured to have a base radius of 5 cm and a height of 15 cm, both rounded to the nearest whole centimeter. The volume of the can is calculated based on these measurements. What is the maximum possible error in the calculated volume of the can?
- 232.7 cubic centimeters
- 255.6 cubic centimeters
- 275.3 cubic centimeters
- 294.9 cubic centimeters
Question 48.
Two distinct angles are drawn on a plane so that one pair of rays are collinear and the other pair are parallel. Which of the following statements describes their relationship?
- In all cases, the angles must be congruent.
- In all cases, the angles must be supplementary.
- Depending on their positions, the angles must be either congruent or supplementary.
- Depending on their positions, the angles may be congruent, supplementary, or neither.
Question 49.
Use the information below to answer the question that follows.
Given isosceles triangle PQR with base QR, and a point N on QR such that N is not the midpoint of QR, prove that PN does not bisect angle QPR.
An indirect proof of the statement shown uses which of the following strategies?
- Assume that point N is the midpoint of segment QR and prove that PN bisects angle QPR.
- Assume that segment PN bisects angle QPR and prove that N is the midpoint of segment QR.
- Assume that triangle PQR is not isosceles and prove that segment PN bisects angle QPR.
- Assume that segment PN bisects angle QPR and prove that segment QR cannot be the base of triangle PQR.
Question 50.
In a regular polygon, the measure of one interior angle is 12 degrees larger than 6 times the measure of one exterior angle. How many sides does this polygon have?
- 15
- 18
- 20
- 24
Question 51.
A parallelogram is inscribed in a circle. This parallelogram must be a:
- rectangle.
- square.
- rhombus.
- kite.
Question 52.
Use the information below to answer the question that follows.
Given: triangle ABC
Prove: Area = 1 half A B times A C times sine A
Given that the area of a triangle is one-half the product of its base and height, which of the following is a true statement regarding the proof asked for above?
- The area formula can be proven if a height h is drawn from B to A C and sine A = A B divided by h is used.
- The area formula can be proven if a height h is drawn from B to A C and sin A = sine A = h divided by AB is used.
- The area formula is true only for right triangles because sine 90 degrees = 1, and A B and A C will be the base and height.
- The area formula is true only if angle A is less than or eaul to 90 degrees , since the height drawn to A C needs to go through the interior of the triangle in order to use the correct sine ratio.
Question 53.
Use the diagram below to answer the question that follows.
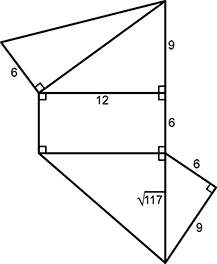
A net is shown composed of a rectangle with dimensions 12 units by 6 units. The top side of the rectangle measuring 12 units forms the long leg of a right triangle, with a short leg measuring 9 units. The hypotenuse of the triangle is also the long leg of an adjoining right triangle with a short leg measuring 6 units. The bottom side of the rectangle forms a right triangle with short leg measuring radical 117 units. This side is also the hypotenuse of an adjoining right triangle with side lengths of 6 units and 9 units.
The diagram above represents the net of a three-dimensional solid. What is the volume of the solid?
- 12 radical 117 cubic units
- 216 cubic units
- 24 radical 117 cubic units
- 324 cubic units
Question 54.
Points A and B are midpoints of the opposite edges of a single face of a cube. At a 45 degree angle to this face of the cube, a plane cuts through the cube through points A and B. What is the most descriptive name for the quadrilateral formed on the surface of this cut?
- parallelogram
- rhombus
- rectangle
- square
Question 55.
Use the diagram below to answer the question that follows.
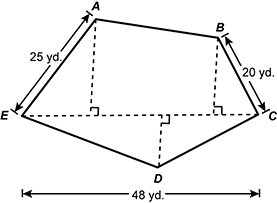
A pentagon is shown with vertices A B C D and E. The length of A E is 25 yards. The length of B C is 20 yards, and the linear distance between E and C is 48 yards. The pentagon is divided into several nonoverlapping regions, some of which are right triangles.
Pentagon A B C D E represents an irregular plot of land. The distances from points A, B, and D to diagonal E C measure 20 yards, 16 yards, and 10 yards, respectively. The land is to be seeded with grass at the rate of 3 pounds of seed for every 1000 square feet. Approximately how many pounds of grass seed are needed?
- 7.8 pounds
- 11.2 pounds
- 19.7 pounds
- 23.3 pounds
Question 56.
To determine container size for a product, one measure used by a manufacturer is the packaging efficiency ratio, which is defined as the ratio of the surface area of the container to the volume of the container. The manufacturer currently uses a container that is a cylinder with an efficiency ratio r. If a similar cylinder is to be created by multiplying each linear measurement of the existing container by a scale factor of k, what will be the efficiency ratio of the new container?
- r divided by k
- k r
- r divided by k cubed
- k cubed r
Question 57.
Use the diagram below to answer the question that follows.
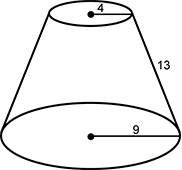
The frustum of a cone is created by cutting off the top of the cone with a slice parallel to the base of the cone, as shown in the diagram. The radii of the parallel faces are 4 units and 9 units. The slant height of the frustum is 13 units
The frustum of a cone is created by cutting off the top of the cone with a slice parallel to the base of the cone, as shown in the diagram. The radii of the parallel faces are 4 units and 9 units. The slant height of the frustum is 13 units. To the nearest tenth of a unit, what is the height of the cone from which this frustum was created?
- 16.5 units
- 17.3 units
- 20.8 units
- 21.6 units
Question 58.
Use the equation below to answer the question that follows.
x squared + y minus 4 the quantity squared = 25
A parabola has x-intercept (1, 0) and the same y-intercepts as the graph of the equation shown. Which of the following equations represents the parabola?
- y = negative one ninth times the quantity x squared minus 9
- y = negative one ninth times the quantity x squared minus 8 x minus 9
- x = negative one ninth times the quantity y squared minus 9
- x = negative one ninth times the quantity y squared minus 8 y minus 9
Question 59.
What are the x-coordinates of the foci of the ellipse represented by 4 x squared plus 9 y squared plus 16 x minus 18 y = 11 ?
- 1 plus or minus radical 5
- 1 plus or minus radical 13
- negative 2 plus or minus radical 5
- negative 2 plus or minus radical 13
Question 60.
Which of the following equations represents the perpendicular bisector of the line segment connecting A, 1, negative 7, to B, 5, 3 ?
- 2 x + 5 y = negative 4
- 2 x + 5 y = 29
- 5 x + 2 y = 11
- 5x + 2y = 20
Question 61.
Triangle A B C is drawn on a coordinate plane with vertices A at negative 6 8, B at negative 4 2, and C at 5 2 . Triangle A B C undergoes a dilation centered at point C with a scale factor of 4 thirds to form triangle A prime B prime C prime . What is the area of triangle A prime B prime C prime ?
- 36
- 12 radical 10
- 48
- 16 radical 10
Question 62.
Which of the following statements is valid in spherical geometry?
- Through any two points there is exactly one line.
- When two lines intersect, vertical angles are equal.
- The sum of the angles of any triangle is equal to 180 degrees.
- Through a point outside a given line, exactly one line can be drawn that does not intersect the given line.
Question 63.
Use the tire tread design below to answer the question that follows.
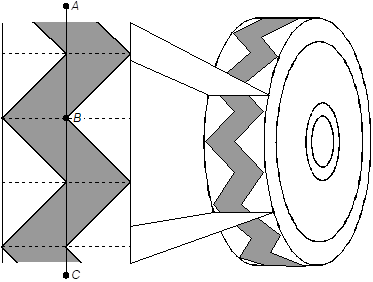
A tread pattern for a tire is shown. The tread is in the shape of a thick line that zig zags in a wave pattern vertically. The vertical line segment A C passes through the midline of the wave pattern. Point B is on A C, located at the rightmost point on the tread when the shape of the tread is pointing to the left.
Under which of the following transformations will the design remain unchanged?
- dilation with respect to point B
- 180 degrees rotation around point B
- reflection across A C
- glide-reflection along A C
Question 64.
A snack cracker company puts a coupon in each box. Twenty percent of the coupons are for a discount on a particular brand of cheese. Assuming that the distribution of boxes is random among supermarkets, which of the following simulations could be used to determine the average number of boxes a person needs to buy to get a coupon for the cheese?
- Use a random number table and assign the number 20 as a success. Read two-digit numbers until a 20 is read. Record the number of numbers read including the last one. Repeat 100 times.
- Toss 2 fair coins 10 times. Assign heads as a success and count the number of times exactly 2 heads comes up. Repeat 100 times.
- Use a random number table and assign the digits 0 and 1 as successes. Read single digits until a 0 or a 1 is read. Record the number of numbers read including the last one. Repeat 100 times.
- Toss a fair coin 5 times. Assign heads as a success and count the number of times heads comes up. Repeat 100 times.
Question 65.
What is the probability that any two real numbers between 1 and 7 inclusive, selected at random, will have a sum of at least 6?
- 2 ninths
- 7 ninths
- 10 40 ninths
- 30 40 ninths
Question 66.
Use the diagram below to answer the question that follows.
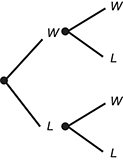
A tree diagram is shown with two initial branches: W and L. Each branch splits into another two branches marked W and L for a total of four branches at the end of the diagram.
The tree diagram shows the potential results for a soccer team that plays against two opponents and will either win (W) or lose (L) each game. The probability that the team will win against the first opponent is 1 third, and the probability that the team will win against the second opponent is 1 fifths. What is the probability that the team will win at least 1 game?
- 4 fifteenths
- 2 fifths
- 7 fifteenths
- 3 fifths
Question 67.
Use the table below to answer the question that follows.
| Sunday | Monday | Tuesday | Wednesday | Thursday | Friday | Saturday |
|---|---|---|---|---|---|---|
| 40 dollars | 50 dollars | 20 dollars | 20 dollars | 20 dollars | 50 dollars | 100 dollars |
Each of 150 people purchased one raffle ticket for a weeklong lottery. Each day a ticket is drawn and the person with the winning ticket wins the amount shown in the table for that day. The winning ticket is then returned, so a person can win multiple times in the week. A person calculated the expected value of the winnings on Sunday before the drawing, did not win on the first 5 days, and then calculated the expected value of the winnings on Friday before the drawing. What is the difference in the expected value of the winnings based on these two calculations?
- 1 dollar
- 2 dollars
- 10 dollars
- 150 dollars
Question 68.
In a school system with 10 elementary schools, the school board is considering requiring students to wear school uniforms. The board wants to find out whether the students' caregivers would support this plan. Which of the following sampling methods would result in the least sampling bias?
- Send a survey home with each student asking caregivers to fill it out and return it within five days.
- Randomly select one of the elementary schools and call each student's caregiver, following up until a response is made.
- Send an e-mail to a random sample of caregivers asking them to log their responses on the school board's website.
- Randomly select 30 caregivers from each school. Send each a survey and follow up with a phone call if they do not return the survey within two weeks.
Question 69.
Use the information below to answer the question that follows.
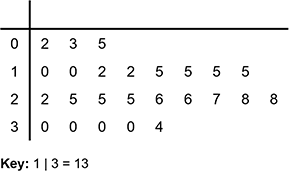
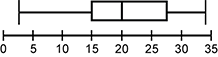
A stem and leaf plot is shown with rows defined by stems of 0, 1, 2, and 3. In the 0 row, the leaves are 2, 3, and 5. In the 1 row, the leaves are 0 0 2 2 5 5 5 5. In the 2 row, the leaves are 2 5 5 5 6 6 7 8 8. In the 3 row, the leaves are 0 0 0 0 4. Key 1 to 3 equals 13
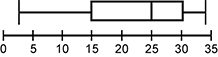
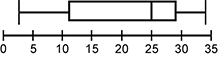
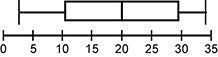
The stem-and-leaf plot shows the minutes on "hold" of 25 randomly chosen callers waiting to speak to a representative of a particular company. Which of the following box plots best summarizes these data?
Question 70.
Each of the numbers in a normally distributed data set is multiplied by two. How does this transformation affect the mean, the median, and the shape of the frequency distribution curve?
- The mean doubles, but the median and the shape stay the same.
- The mean and the median double, and the shape becomes wider.
- The median doubles, but the mean and the shape stay the same.
- The median and the mean stay the same, but the shape becomes wider.
Question 71.
Use the information below to answer the question that follows.
| Linear Regression for Town A | Linear Regression for Town B |
|---|---|
| y = a x + b | y = a x + b |
| a = 0 point 4 6 9 4 3 0 8 2 8 6 | a = 3 point 8 5 7 4 6 9 4 3 4 5 |
| b = 7 point 7 3 8 4 2 5 3 8 6 | b = 2 point 3 9 6 7 3 8 2 6 4 |
| r = 0 point 9 8 3 9 2 6 4 9 1 8 | r = 0 point 0 8 3 8 5 6 7 4 2 6 |
Students use a statistics program to study the populations of two towns. They enter twenty years of population data. The population in thousands is represented by y. The year is represented by x. The program generates the above linear regression results. Which of the following conclusions can be reached from these results?
- The model for Town A is a better predictor of population than the model for Town B.
- The population was initially smaller in Town B than in Town A.
- The model for Town A predicted a faster growth rate than the model for Town B.
- The population growth rate was accelerating in Town B and decelerating in Town A.
Question 72.
What is the limit as x approaches 1 of 1 minus x divided by the binomial x squared minus 1?
 ?
?- negative 1 half
- 0
- 1
- Limit does not exist.
Question 73.
Which of the following equations represents the line tangent to  at x = 1?

Question 74.
When a drop of water falls into a pond, it creates a circular ripple that expands outward at 9 inches per second. What is the approximate instantaneous rate of change of the area enclosed by the circular ripple after 2 seconds?
- 1.5 square feet per second
- 7.1 square feet per second
- 9.4 square feet per second
- 18.9 square feet per second
Question 75.
Which of the following functions is continuous for all real values of x?
- f of x equals the binomial x squared minus 9 divided by the binomial x minus 3
- f of x equals the binomial x squared minus 9 divided by the square root of the binomial x minus 3
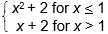
- f of x equals a piecewise defined function that has a value of x squared plus 2 for x less than or equal to 1 and a value of x plus 2 for x greater than 1
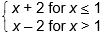
- f of x equals a piecewise defined function that has a value of x minus 2 for x less than or equal to 1 and a value of x minus 2 for x greater than 1


Question 76.
Which of the following equations represents the derivative with respect to x for the function f of x equals open paren 2 times x superscript 4 + 3 closed paren superscript 5 ?
- f prime of x equals 40 times x cubed times open paren 2 times x superscript 4 plus 3 closed paren superscript 4
- f prime of x equals 8 times x cubed times open paren 2 times x superscript 4 plus 3 closed paren superscript 5
- f prime of x equals 5 times open paren 2 times x superscript 4 plus 3 closed paren superscript 4
- f prime of x equals open paren 8 times x cubed plus 3 closed paren superscript 5
Question 77.
Use the graph below to answer the question that follows.
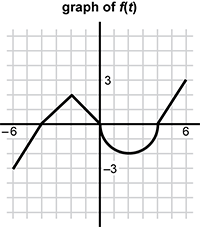
A graph of a function is shown with a constant rate of change of 2 thirds from the point negative 6 negative 3 to the point 0 negative 4. The function has a constant rate of change of 1 from the point 0 negative 4 to the point negative 3 negative 2. The function has a constant rate of change of negative 1 from the point negative 2 negative 2 to the origin. The function has a semicircular shape, with a radius of 2, below the x axis from the origin to the point 0 four. The function has a constant rate of change of 2 thirds from the point 0 4 to the point 6 3.
The graph of a function f of t is shown on the interval negative 6 to 6, inclusive . It consists of line segments and a semicircle. Let G of x =  . Where in the interval negative 6 to 6, inclusive does the graph of G of x achieve its minimum value?
- x = negative 6
- x = negative 4
- x = 2
- x = 4
Question 78.
The integral 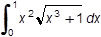 may be evaluated using the substitution u = x cubed + 1. What is the value of this definite integral?
- 2 ninths
- 2 thirds
- 2 ninths times the quantity 2 radical 2 minus 1
- two thirds times the quantity 2 radical 2 minus 1
Question 79.
Which of the following expressions represents  ?
?
- 1 + 5 over x + C
- x + 5 over x + C
- 1 minus 15 over x squared + C
- x minus 15 over x squared + C
Question 80.
Use the graph below to answer the question that follows.
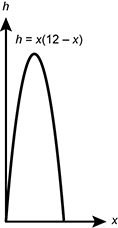
The graph of a parabola that opens down is shown in the first quadrant of the coordinate plane. The vertical axis is labeled h and the horizontal axis is x. The function h of x equals x times the quantity 12 minus x intercepts the x axis once at the origin and again at a positive value for x.
An architect designs a glass wall that extends from the ground up to a curved metal frame represented by the function h of x equals x times the quantity 12 minus x . In the graph shown, h represents the height of the frame, and the x-axis represents the ground. Both variables are measured in feet. How much glass does the architect need for the wall?
- 288 square feet
- 339 square feet
- 4608 square feet
- 5184 square feet
Question 81.
Use the function below to answer the question that follows.
c of t equals 1 point 2 times e to the power of 0 point 1 4 t.
The manager of a new water treatment plant estimates that the plant's capacity will grow according to the function above, where c of t represents capacity rate in millions of gallons per year and t represents the number of years since the plant opened. Based on this estimate, which of the following approximates the total number of gallons of water that will be treated in the first five years that the plant is open?
- 2.4 million gallons
- 8.7 million gallons
- 9.3 million gallons
- 17.3 million gallons
Question 82.
A student is using mathematical induction to prove that the sum of the first n odd numbers is n squared . The student demonstrates that the sum is correct when n = 1. The student then assumes that it is true for the first k odd numbers and writes 1 + 3 + 5 + 7 + dot dot dot 2 k minus 1 = k squared . The student must now show that:
- 1 + 3 + 5 + 7 + dot dot dot 2 k minus 1 + 2 k = k squared + 1
- 1 + 3 + 5 + 7 + dot dot dot 2 k minus 1 + 2 k = (k + 1) squared
- 1 + 3 + 5 + 7 + dot dot dot 2 k minus 1 + (2 k + 1) = k squared + 1
- 1 + 3 + 5 + 7 + dot dot dot 2 k minus 1 + (2 k + 1) = (k + 1) squared
Question 83.
Use the matrix below to answer the question that follows.
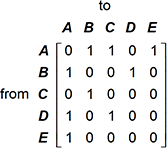
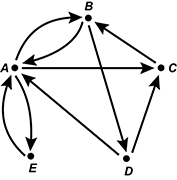
A 5 by 5 matrix is shown. Elements by row follow. Row 1 0, 1, 1, 0, 1. Row 2 1, 0, 0, 1, 0. Row 3 0, 1, 0, 0, 0. Row 4 1, 0, 1, 0, 0. Row 5 1, 0, 0, 0, 0. The letters A, B, C, D, and E are written above the elements in the first row, and the word to is centered above those letters. The same letters also appear to the left of the elements in the first column, and the word from is centered to the left of those letters.
The matrix shown models communication between computers A, B, C, D, and E. Communication from one computer to another is given in each row, with a 1 indicating communication and a 0 indicating no communication. Which of the following directed graphs represents this communication network?
-
 Points A through E are arranged in the shape of a regular pentagon. The points are connected with arrows as follows:
from point A to points B, C, and E;
from point B to point D;
from point C to point B;
from point D to points A and C.
No arrows original from point E.
Points A through E are arranged in the shape of a regular pentagon. The points are connected with arrows as follows:
from point A to points B, C, and E;
from point B to point D;
from point C to point B;
from point D to points A and C.
No arrows original from point E.
-
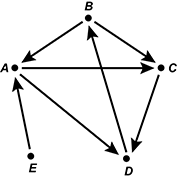 Points A through E are arranged in the shape of a regular pentagon. The points are connected with arrows as follows:
from point A to points C, and D;
from point B to points A and C;
from point C to point D;
from point D to point B;
from point E to point A.
Points A through E are arranged in the shape of a regular pentagon. The points are connected with arrows as follows:
from point A to points C, and D;
from point B to points A and C;
from point C to point D;
from point D to point B;
from point E to point A.
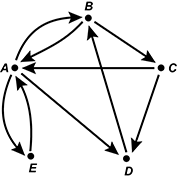
-
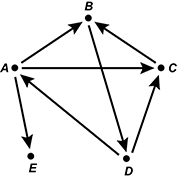
 Points A through E are arranged in the shape of a regular pentagon. The points are connected with arrows as follows:
from point A to points B,C, and E;
from point B to points A and D;
from point C to point B;
from point D to points A and C;
from point E to point A.
Points A through E are arranged in the shape of a regular pentagon. The points are connected with arrows as follows:
from point A to points B,C, and E;
from point B to points A and D;
from point C to point B;
from point D to points A and C;
from point E to point A.
-
 Points A through E are arranged in the shape of a regular pentagon. The points are connected with arrows as follows:
from point A to points B and E;
from point B to points A and C;
from point C to points A and D;
from point D to point B;
from point E to point A.
Points A through E are arranged in the shape of a regular pentagon. The points are connected with arrows as follows:
from point A to points B and E;
from point B to points A and C;
from point C to points A and D;
from point D to point B;
from point E to point A.
Question 84.
Use the Venn diagram below to answer the question that follows.
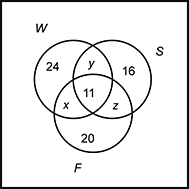
A Venn diagram is shown with circles labeled W, S, and F. W contains sections 24, x, 11, and y. S contains sections 16, y, 11, and z. F contains sections 20, x, 11, and z. Sections of different circles with the same values describe overlapping regions.
Of the 212 students in a particular high school, 50 played fall sports, 49 played winter sports, and 48 played spring sports. Eleven played sports in all three seasons, while 20 played only fall sports, 24 played only winter sports, and 16 played only spring sports. Based on this information and the partially completed Venn diagram shown, how many students played no sports in any of the three seasons?
- 65 students
- 87 students
- 114 students
- 136 students
Question 85.
In a nature preserve, 2 naturalists must accompany every group of 12 visitors who want to hike the trails in the preserve. One naturalist must be the first person on the trail and the other naturalist must be the last. If the naturalists and the visitors hike single file, in how many different orders may they arrange themselves on the trail?
- 12 factorial
- 2 times 12 factorial
- 14 factorial
- 2 times 14 factorial
Open-Response Items
The directions shown below represent what you will see on the actual test. For the purposes of this practice test, you will be able to type your written responses in the boxes provided on the answer key.
This section of the test consists of two open-response item assignments. You will be asked to prepare a written response of approximately 150–300 words, or 1–2 pages, for each assignment.
Read the assignments carefully before you begin your responses. Think about how you will organize your responses. You may use the erasable sheet(s) to make notes, write an outline, or otherwise prepare your responses. However, your final response to each assignment must be either:
- typed into the on-screen response box,
- written on a response sheet and scanned using the scanner provided at your workstation, or
- provided using both the on-screen response box (for typed text) and a response sheet (for calculations or drawings) that you will scan using the scanner provided at your workstation.
Instructions for scanning your response sheet(s) are available by clicking the "Scanning Help" button at the top of the screen.
As a whole, your response to each assignment must demonstrate an understanding of the knowledge of the field. In your response to each assignment, you are expected to demonstrate the depth of your understanding of the subject area by applying your knowledge rather than by merely reciting factual information.
Your responses to the assignments will be evaluated based on the following criteria.
- Purpose: the extent to which the response achieves the purpose of the assignment
- Subject Knowledge: appropriateness and accuracy in the application of subject knowledge
- Support: quality and relevance of supporting evidence
- Rationale: soundness of argument and degree of understanding of the subject area
The open-response item assignments are intended to assess subject knowledge. Your responses must be communicated clearly enough to permit valid judgment of the evaluation criteria by scorers. Your responses should be written for an audience of educators in this field. The final version of each response should conform to the conventions of edited American English. Your responses should be your original work, written in your own words, and not copied or paraphrased from some other work.
Be sure to write about the assigned topics. Remember to review your work and make any changes you think will improve your responses.
Any time spent responding to an assignment, including scanning the response sheet(s), is part of your testing time. Monitor your time carefully. When your testing time expires, a pop-up message will appear on-screen indicating the conclusion of your test session. Only response sheets that are scanned before you end your test or before time has expired will be scored. Any response sheet that is not scanned before testing ends will NOT be scored.
Question 86.
Use the information below to complete the assignment that follows.
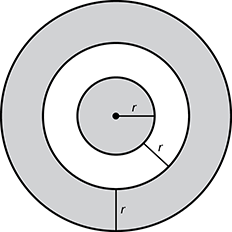
A figure of a dartboard is shown with three concentric circles. The innermost circle is shaded and has a radius of r. The annulus bounded by the innermost circle and the second concentric circle is unshaded and has a width of r. The annulus bounded between the second and third circles is shaded and has a width of r.
Use your knowledge of geometry and quadratic functions to develop a response of approximately 150–300 words, or 1–2 pages, in which you analyze the area of the shaded regions as a function of the radius of the innermost circle, r. In your response:
- find a formula that describes the area of the shaded regions of the dartboard as a function of the radius of the innermost circle, r;
- graph the equation on a coordinate grid, including all appropriate labels, and explain the meaning of any intercepts and extrema in the context of this situation;
- use the equation to calculate the radius of the innermost circle of a similar dartboard that has the shaded regions with a combined area of 150 pi square units; and
- describe how the area of the shaded regions would change if the length of the radius of the innermost circle were doubled.
Be sure to show your work and explain the reasoning you use in analyzing and solving this problem.
Question 87.
Use the information below to complete the assignment that follows.
A city water bureau gets most of the water the city consumes from a reservoir in the mountains that is supplied by rainfall. During the summer, however, there isn't enough rainfall to resupply the reservoir, so water levels in the reservoir fall. When this happens, the bureau has to approve the activation of additional water sources to supplement the water coming in from the reservoir. The bureau estimates that the additional water sources reduce the draw on the reservoir by 4 inches per week.
One summer, the bureau activates the additional water sources on June 15. The water levels in the reservoir for 10 weeks over a period of three months are shown in the following table.
| Date | May | June | July | |||||||
|---|---|---|---|---|---|---|---|---|---|---|
| 18 | 25 | 1 | 8 | 15 | 22 | 29 | 6 | 13 | 20 | |
| Week | 1 | 2 | 3 | 4 | 5 | 6 | 7 | 8 | 9 | 10 |
| Water Level (in.) |
109 | 104 | 98 | 92 | 84 | 81 | 77 | 74 | 70 | 68 |
Assume that demand for water remains the same throughout the summer, and that regular rainfall starts again at the beginning of October.
Use your knowledge of algebra and statistics to develop a response of approximately 150–300 words, or 1–2 pages, in which you analyze the use of the water sources. In your response:
- draw a graph to show the water levels in the reservoir over time, based on the data in the table;
- predict approximately when the reservoir would have run out of water if the additional sources had not been activated;
- recommend a range of water levels, w, for which the reservoir would need to be supplemented with additional water sources, based on t, the number of weeks remaining until the beginning of October; and
- discuss factors that could influence the accuracy of your prediction and recommendation.
Be sure to show your work and explain the reasoning you use in analyzing and solving this problem.