Understanding and Analyzing Program Data
When test results are released, the following reports and data are made available through the approved official at each Massachusetts educator preparation program. These reports and data files:
- are for use by educator preparation program faculty and administrators
- provide information about candidates who indicated during registration that the educator preparation program or organization should receive their test results.
The table below and the information that follows describes the reports and data files available to educator preparation programs.
| Title | Format | Release Schedule | Use |
|---|---|---|---|
| Alphabetical Roster Report | Printable PDF | Via secure Internet site each score reporting date by 5:00 p.m. eastern time. | View candidate test results for the reporting period |
| Institution Roster by Test | Printable PDF | Via secure Internet site each score reporting date by 5:00 p.m. eastern time. | View candidate test results for each test Review aggregate pass rate results for the educator preparation program and the state by test |
| Data File | ASCII file format | Via secure Internet site each score reporting date by 5:00 p.m. eastern time. | Download and import into educator preparation program databases or applications to view and analyze test scores |
| ResultsAnalyzer™ | Software Application | Automatically updated 2–3 business days after results releases | View reports at the candidate and educator preparation program level Generate custom reports |
Alphabetical Roster Report
Description. This report includes the names of all candidates (in alphabetical order) who tested on the date or period indicated. For each candidate, the report provides:
- candidate's MEPID number, an 8-digit number beginning with "5";
- passing status for each test and subtest taken (P = Pass, NP = Did not pass); and
- scaled scores for tests and subtests not passed.
Sample Alphabetical Roster Report
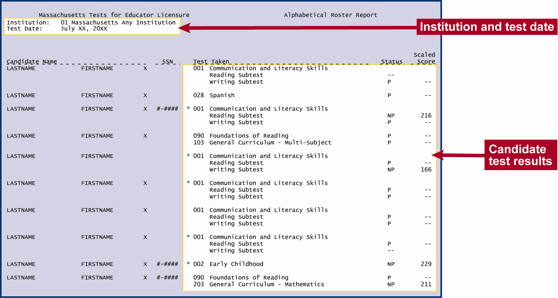
The next two lines say Institution: 01 Massachusetts Any Institution and Test Date: July xx, 20xx. A callout identifies these two lines as the Institution and test date.
The body of the report is a table. The first three columns are the Candidate Name, listed as the last name, first name, and middle initial. All of the entries in the sample say LASTNAME, FIRSTNAME, and X or blank. On an actual form, the names would appear in alphabetical order by last name. The fourth column is the last 5 digits of the candidate's social security number. Some entries appear as 0-0000, but most are blank. The remaining columns are collectively identified by a red callout as the Candidate test results. The first two columns are the Test Taken, listed as the field number and name. Six of the entries are 001 Communication and Literacy Skills, Reading Subtest, Writing Subtest. Additional entries are 028 Spanish, 090 Foundations of Reading, 103 General Curriculum - Multi-Subject, 002 Early Childhood, and 203 General Curriculum - Mathematics. The next column is the Status. Some entries are blank, some appear as P, and some appear as NP. The last column is the Scaled Score. Most entries appear as two dashes, but some appear as numbers: 216 and 166 for two of the Communication and Literacy Skills scores, 229 for the Early Childhood, and 211 for the General Curriculum - Mathematics.
Use. This report may be useful in answering the following types of questions.
- Did candidate "LASTNAME FIRSTNAME" pass a specific test during the reporting period?
- If candidate "LASTNAME FIRSTNAME" did not pass, what was the total test score?
Institution Roster by Test
Description. This report presents by test individual and summary score performance information for the educator preparation program as well as the state summary score performance for candidates who tested on the date or period indicated.
Individual candidate score information includes:
- candidate's MEPID number, an 8-digit number beginning with "5";
- test date;
- candidate's pass/fail status; and
- for candidates who do not meet the qualifying score, total test scaled score.
Summary score information includes:
- the number of candidates who tested;
- the number and percentage who did and did not meet the qualifying score;
- educator preparation program performance—mean scaled score and subarea performance indices; and
- statewide performance—mean scaled score and subarea performance indices.
Test-level data reported are similar to what appears on candidate score reports, but in a more condensed format.
Sample Roster by Test Report
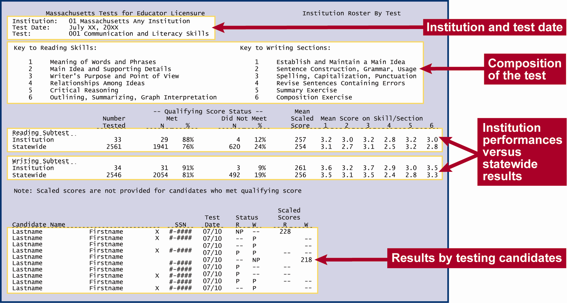
The next three lines say Institution: 01 Massachusetts Any Institution, Test Date: July xx, 20xx, and Test: 001 Communication and Literacy Skills. A callout identifies these three lines as the Institution and test date.
The next block of information is identified by a red callout as the Composition of the test. It provides a key to each subtest. They say:
Key to Reading Skills:
1. Meaning of Words and Phrases
2. Main Idea and Supporting Details
3. Writer's Purpose and Point of View
4. Relationships Among Ideas
5. Critical Reasoning
6. Outlining, Summarizing, Graph Interpretation
Key to Writing Sections:
1. Establish and Maintain a Main Idea
2. Sentence Construction, Grammar, Usage
3. Spelling, Capitalization, Punctuation
4. Revise Sentences Containing Errors
5. Summary Exercise
6. Composition Exercise
The next block of information is identified by a red callout as the Institution performances versus statewide results. Statistics for the institution and the statewide statistics are provided one above the other for easy comparison. The sample shows statistics for the Reading Subtest and the Writing Subtest as two separate tables. I will read only the Reading Subtest example.
Reading Subtest.
Number Tested. Institution, 33. Statewide, 2561.
Qualifying Score Status.
Met, Number. Institution, 29. Statewide, 1941.
Met, percentage. Institution, 88%. Statewide, 76%.
Did Not Meet, number. Institution, 4. Statewide, 620.
Did Not Meet, percentage. Institution, 12%. Statewide, 24%.
Mean Scaled Score. Institution, 257. Statewide, 254.
Mean Score on Skill/Section.
Skill/Section 1. Institution, 3.2. Statewide, 3.1.
Skill/Section 2. Institution, 3.0. Statewide, 2.7.
Skill/Section 3. Institution, 3.2. Statewide, 3.1.
Skill/Section 4. Institution, 2.8. Statewide, 2.5.
Skill/Section 5. Institution, 3.2. Statewide, 3.2.
Skill/Section 6. Institution, 3.0. Statewide, 2.8.
Below the Writing Subtest table is the following text: Note: Scaled scores are not provided for candidates who met qualifying score
The remaining block of information is identified by a red callout as the Results by testing candidates. The first three columns are the Candidate Name, listed as the last name, first name, and middle initial. All of the entries in the sample say LASTNAME, FIRSTNAME, and X or blank. On an actual form, the names would appear in alphabetical order by last name. The fourth column is the last 5 digits of the candidate's social security number. Some entries appear as 0-0000, but most are blank. The next column is the Test Date. All entries are 07/10. The next two columns are the Status. The first is for the Reading subtest and the second is for the Writing subtest. Some candidates have blank for the Reading subtest and P for the Writing subtest. Some have P for the Reading subtest and blank for the Writing subtest. Some have P for the Reading subtest and P for the Writing subtest. One has NP for the Reading subtest and blank for the Writing subtest, and one has blank for the Reading subtest and NP for the Writing subtest. The next two columns are the Scaled Scores. The first is for the Reading subtest and the second is for the Writing subtest. This information is provided only for the NP results, so 228 appears for the NP in the Reading subtest and 218 appears for the NP in the Writing subtest.
Use. In addition to using individual candidate information, educator preparation programs may find the total test and subarea performance information valuable for identifying courses or curriculum areas that may need to be adapted to strengthen students' content knowledge. Using the test information, including subarea performance indices, along with the test objective-course alignment information in the Objective-to-Course Matching Chart ![]() may give you a broader understanding of the strengths and weaknesses of individual students and the curriculum.
may give you a broader understanding of the strengths and weaknesses of individual students and the curriculum.
ASCII data files
ASCII data files are made available to educator preparation programs for downloading and importing test results into their software databases or applications, allowing customized formatting and analysis of test scores. A readme file![]() on the secure website facilitates understanding of the data file format (note that the format of the readme file shown here is effective beginning May 12, 2017).
on the secure website facilitates understanding of the data file format (note that the format of the readme file shown here is effective beginning May 12, 2017).
ResultsAnalyzer™
In addition to the reports and data file provided on the test results release dates, educator preparation programs can see reports and generate custom reports that include up-to-date results for the educator preparation program through the software program that is made available to authorized users of the score-reporting system, ResultsAnalyzer. This score reporting system allows users to:
- view, analyze, reorganize, download, and print reports based on test results data and on background information gathered during test registration; and
- instantly access candidate, test, and program data.
You can use ResultsAnalyzer to:
- create relevant and timely reports on candidate and educator preparation program test results;
- customize data queries to align with program goals and areas of interest;
- aggregate performance data across testing program years;
- export data to Excel or other report software;
- print graphics; and
- analyze candidate and program data for numerous variables (including self-reported data, such as gender and education level).
Interpretive Cautions
When reviewing the institution reports and data, please keep in mind the interpretive cautions made available with each. In general, these include:
- Results based on smaller numbers of candidates are typically less stable than those based on larger numbers, and may not provide a reliable indication of how candidates at an educator preparation program typically perform.
- The performance of candidates for a particular test reporting period may not predict the performance of other candidates who take the tests in the future.
- Although candidates do not "pass" or "fail" individual subareas or sections, subarea performance information available to candidates on their Individual Score Reports may be useful in understanding candidates' areas of strength and weakness. This information should be interpreted with caution since subareas and sections contain varying numbers of test items.
- Subarea performance information is based on fewer questions than the total test score and may be less reliable as an indication of performance.
- The individual candidate information contained in the program-level score reports is confidential and must not be disclosed to unauthorized persons or educator preparation programs. Appropriate safeguards must be implemented by all personnel to protect candidates from improper disclosure of information.
- Individual candidate results are intended to be used for the purpose of Massachusetts educator licensure. The MTEL are not designed to be used for other purposes, including but not limited to employment decisions and admission to or completion of an educator preparation program.
- Candidate test results included in the institution reports are complete as of the date and time the report is released. Additions or changes to this information may occur after this date. The Department maintains an updated file of official results for the purpose of licensure.
Test Results Reported to the Massachusetts Department of Elementary and Secondary Education
Following each MTEL score reporting date, the Department also receives score reports that include:
- the Alphabetical Roster Report
- the Institution Roster by Test Report
- a Pass Rate Report
- ASCII file, from which individual candidate data are also uploaded to ELAR, the state's online licensure and recruitment system, after each score reporting date
- ResultsAnalyzer
Need More Time?
To continue your session, select Stay Signed In.
